Free Access
Fig. 2.
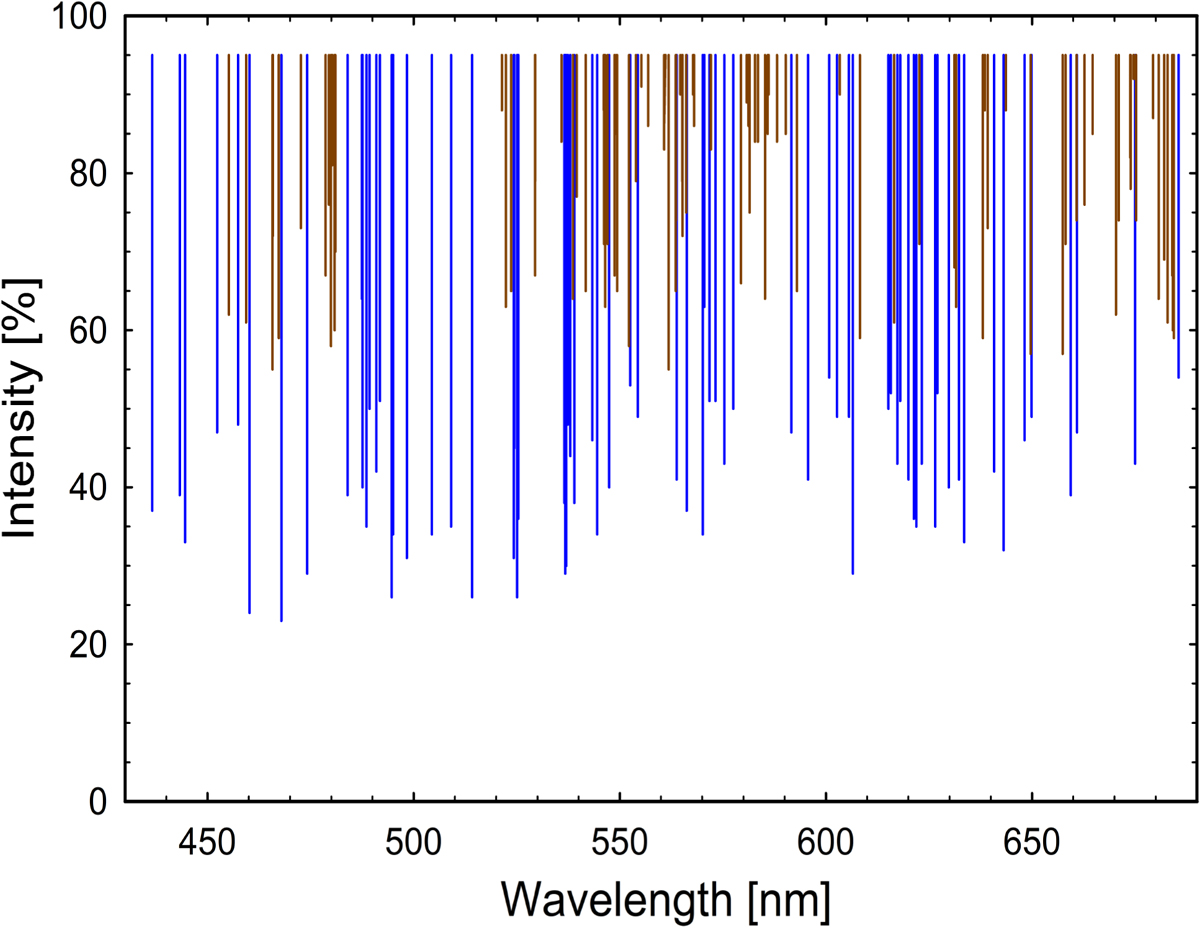
Distribution of the 158 selected Fe I lines. Increased line blending below ~450 nm makes locating unblended lines increasingly difficult. Lines with measured residual central intensity value below and above 55% are indicated in blue and red, respectively (forming strong and weak line groups).
Current usage metrics show cumulative count of Article Views (full-text article views including HTML views, PDF and ePub downloads, according to the available data) and Abstracts Views on Vision4Press platform.
Data correspond to usage on the plateform after 2015. The current usage metrics is available 48-96 hours after online publication and is updated daily on week days.
Initial download of the metrics may take a while.