Fig. 12.
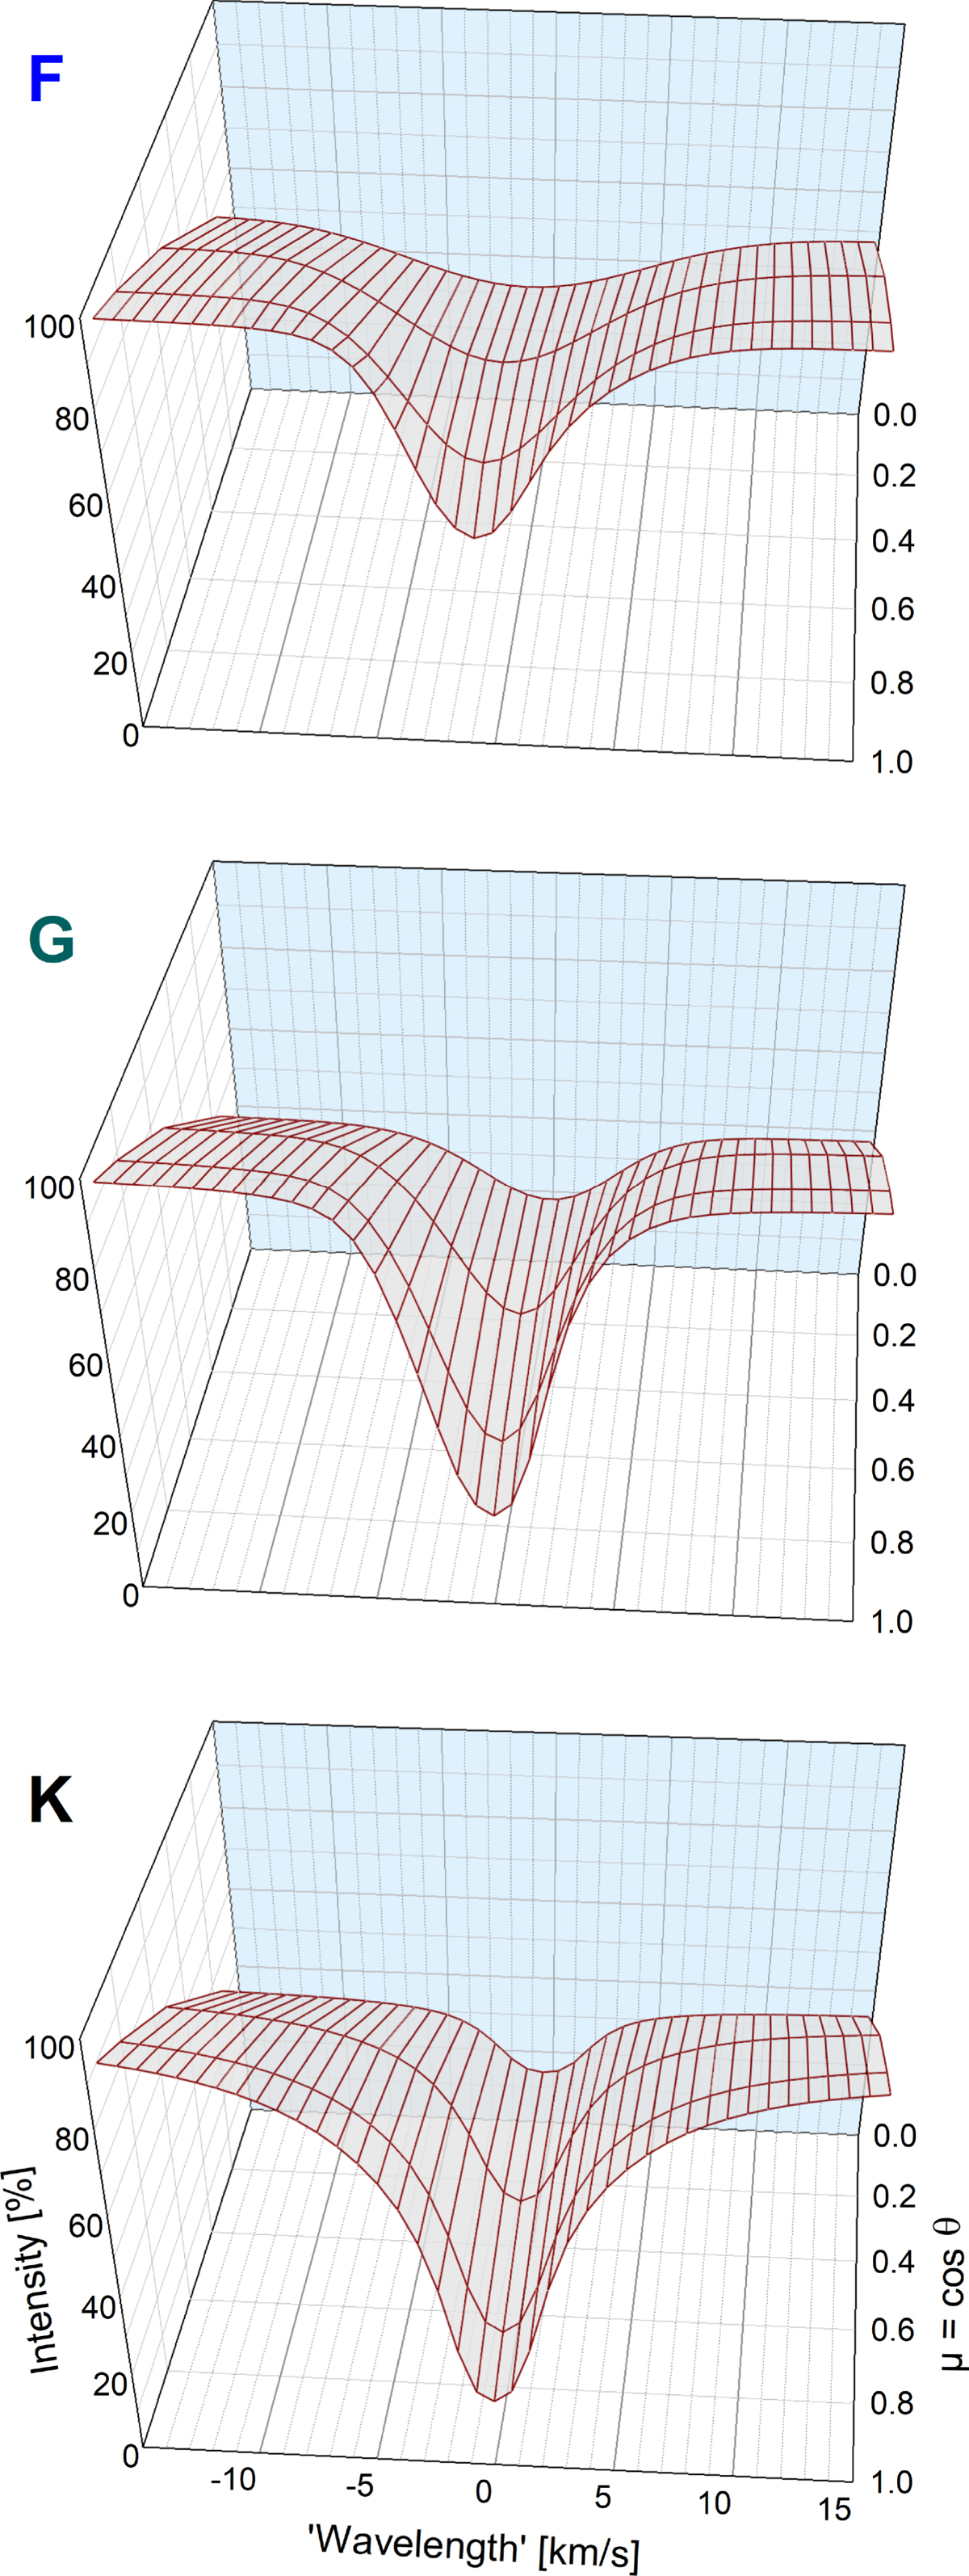
Profiles for an Fe I line (the strongest one in Fig. 11) from models representing main-sequence stars of spectral types F, G, and K, with T eff = 6730, 5900, and 3960 K, show their quite different center-to-limb behavior. The intensity scales are those of stellar disk centers and the varying continuum levels thus reflect the limb darkening, more pronounced in cooler stars.
Current usage metrics show cumulative count of Article Views (full-text article views including HTML views, PDF and ePub downloads, according to the available data) and Abstracts Views on Vision4Press platform.
Data correspond to usage on the plateform after 2015. The current usage metrics is available 48-96 hours after online publication and is updated daily on week days.
Initial download of the metrics may take a while.