Fig. 10.
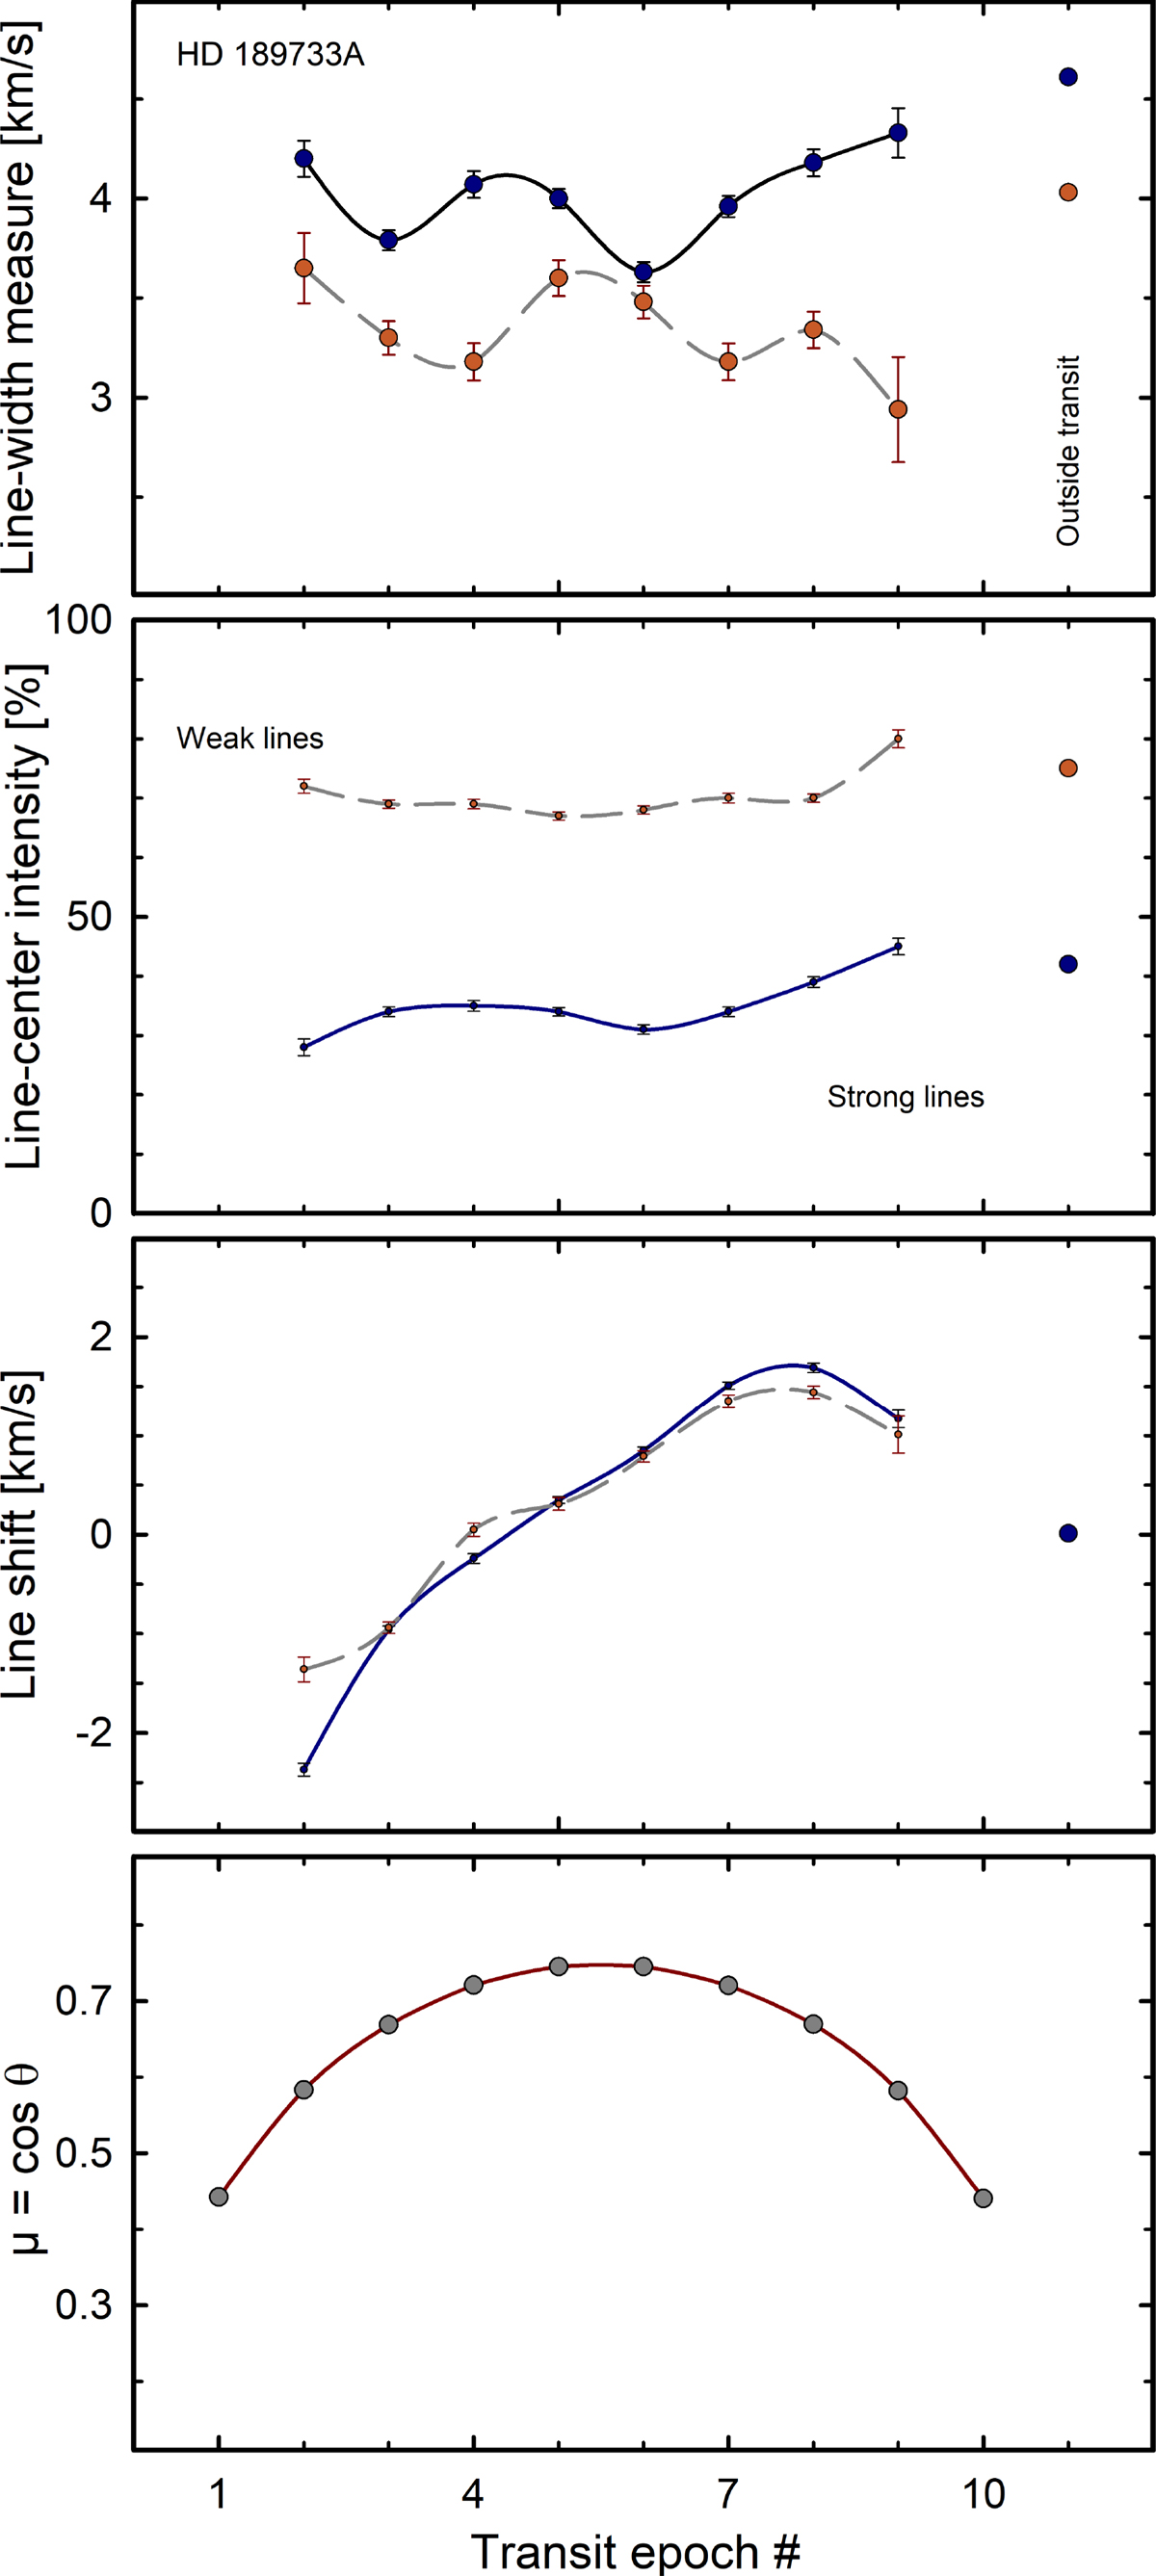
Line-widths, line-bottom intensities, and wavelength shifts of reconstructed profiles for the strong (solid curves) and weak lines (dashed) at eight successive positions during the planetary transit, obtained from Gaussian fits to the data. The error bars denote one standard deviation to these fits but judgments of any apparent dependences should also examine the reconstructed profiles to which these fits were made. The various transit epochs, with their center-to-limb locations shown at bottom, correspond to those in Fig. 1.
Current usage metrics show cumulative count of Article Views (full-text article views including HTML views, PDF and ePub downloads, according to the available data) and Abstracts Views on Vision4Press platform.
Data correspond to usage on the plateform after 2015. The current usage metrics is available 48-96 hours after online publication and is updated daily on week days.
Initial download of the metrics may take a while.