Fig. 1.
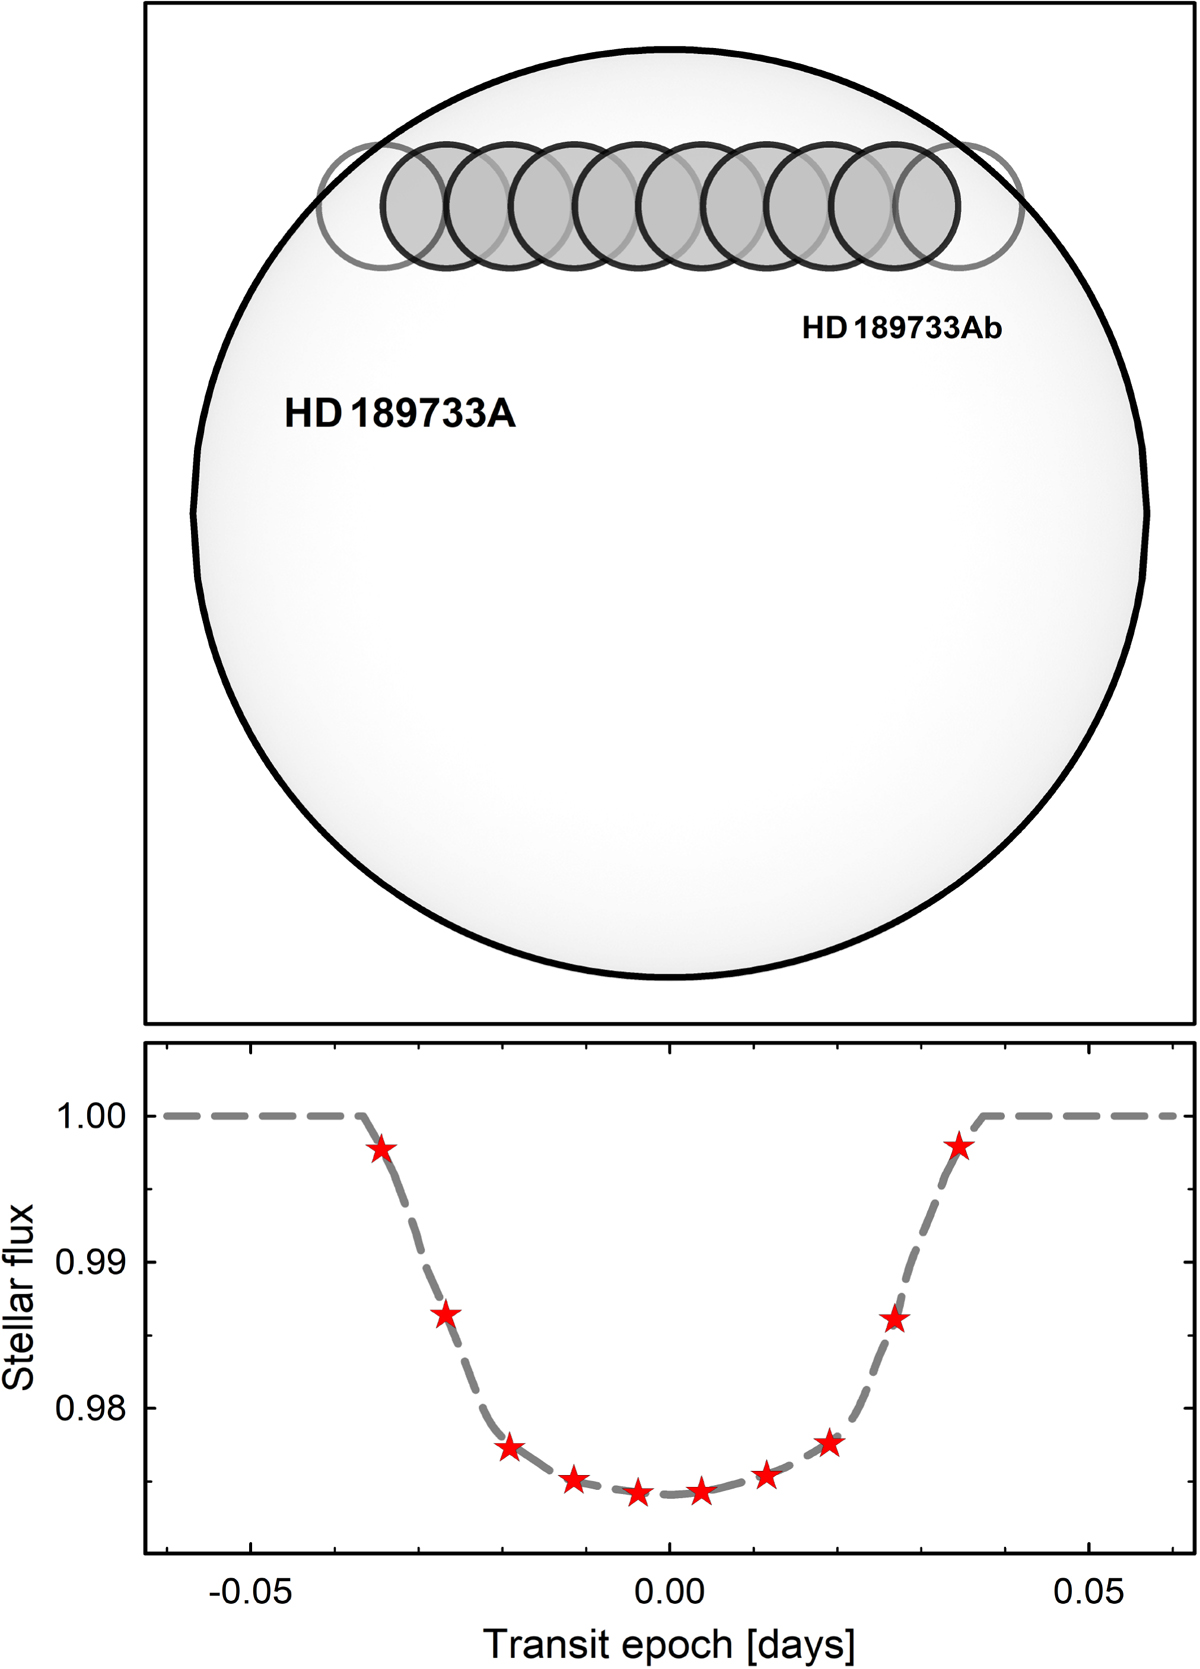
Top: exoplanet transit geometry. Numerous spectral exposures were combined into ten average transit epochs, shown with the planet positions to scale (time increases left to right). Observations close to the limbs did not reach sufficient S/N for the later spectral reconstruction, and those two epochs are shown as open circles. Bottom: phase-folded HST light curve combining three planetary transits by Pont et al. (2007) with the flux at each epoch indicated by stars.
Current usage metrics show cumulative count of Article Views (full-text article views including HTML views, PDF and ePub downloads, according to the available data) and Abstracts Views on Vision4Press platform.
Data correspond to usage on the plateform after 2015. The current usage metrics is available 48-96 hours after online publication and is updated daily on week days.
Initial download of the metrics may take a while.