Fig. B.1.
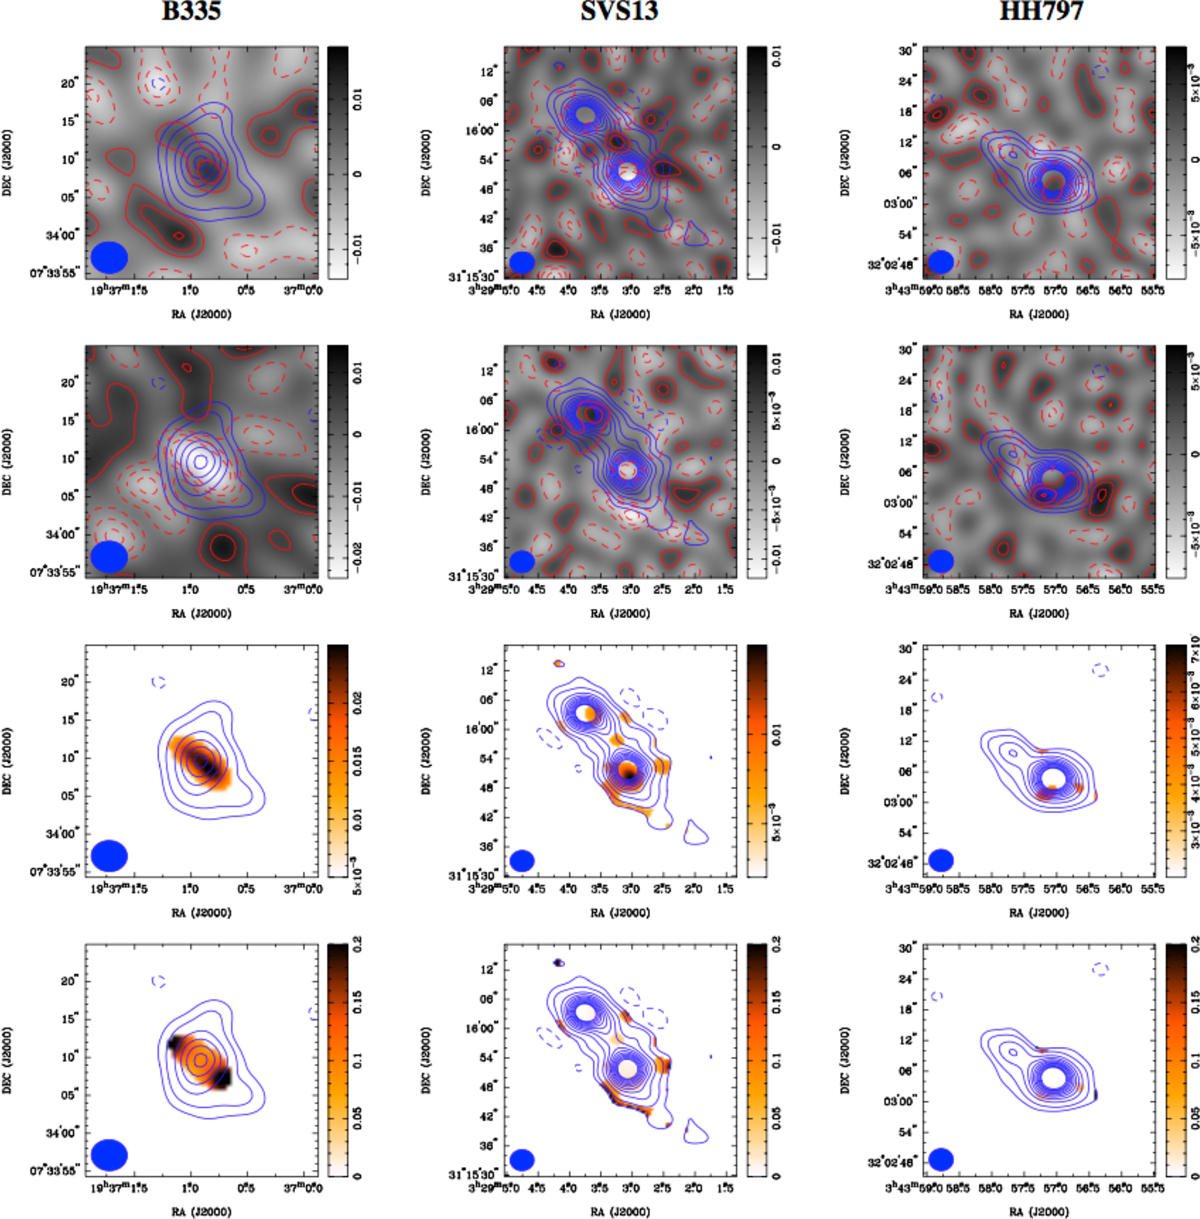
Polarization maps of, from left to right, B335, SVS13 and HH797. Two top panels: Stokes Q and U maps. Color scales are in mJy/beam. Stokes I contours (same as in Fig. 2) appear in blue. Stokes Q and U contours appear in red and are [−3, −2, −1, 1, 2, 3] σ. Third line: polarization intensity maps. The color scale is in mJy/beam. Fourth line: polarization fraction map. The filled ellipses on the bottom left corner indicate the synthesized beam of the SMA maps. Same for L1448C, N and 2A. Same for IRAS03282, L1157, and CB230. Same for NGC 1333 IRAS4A, NGC 1333 IRAS4B, and IRAS16293.
Current usage metrics show cumulative count of Article Views (full-text article views including HTML views, PDF and ePub downloads, according to the available data) and Abstracts Views on Vision4Press platform.
Data correspond to usage on the plateform after 2015. The current usage metrics is available 48-96 hours after online publication and is updated daily on week days.
Initial download of the metrics may take a while.