Fig. 8.
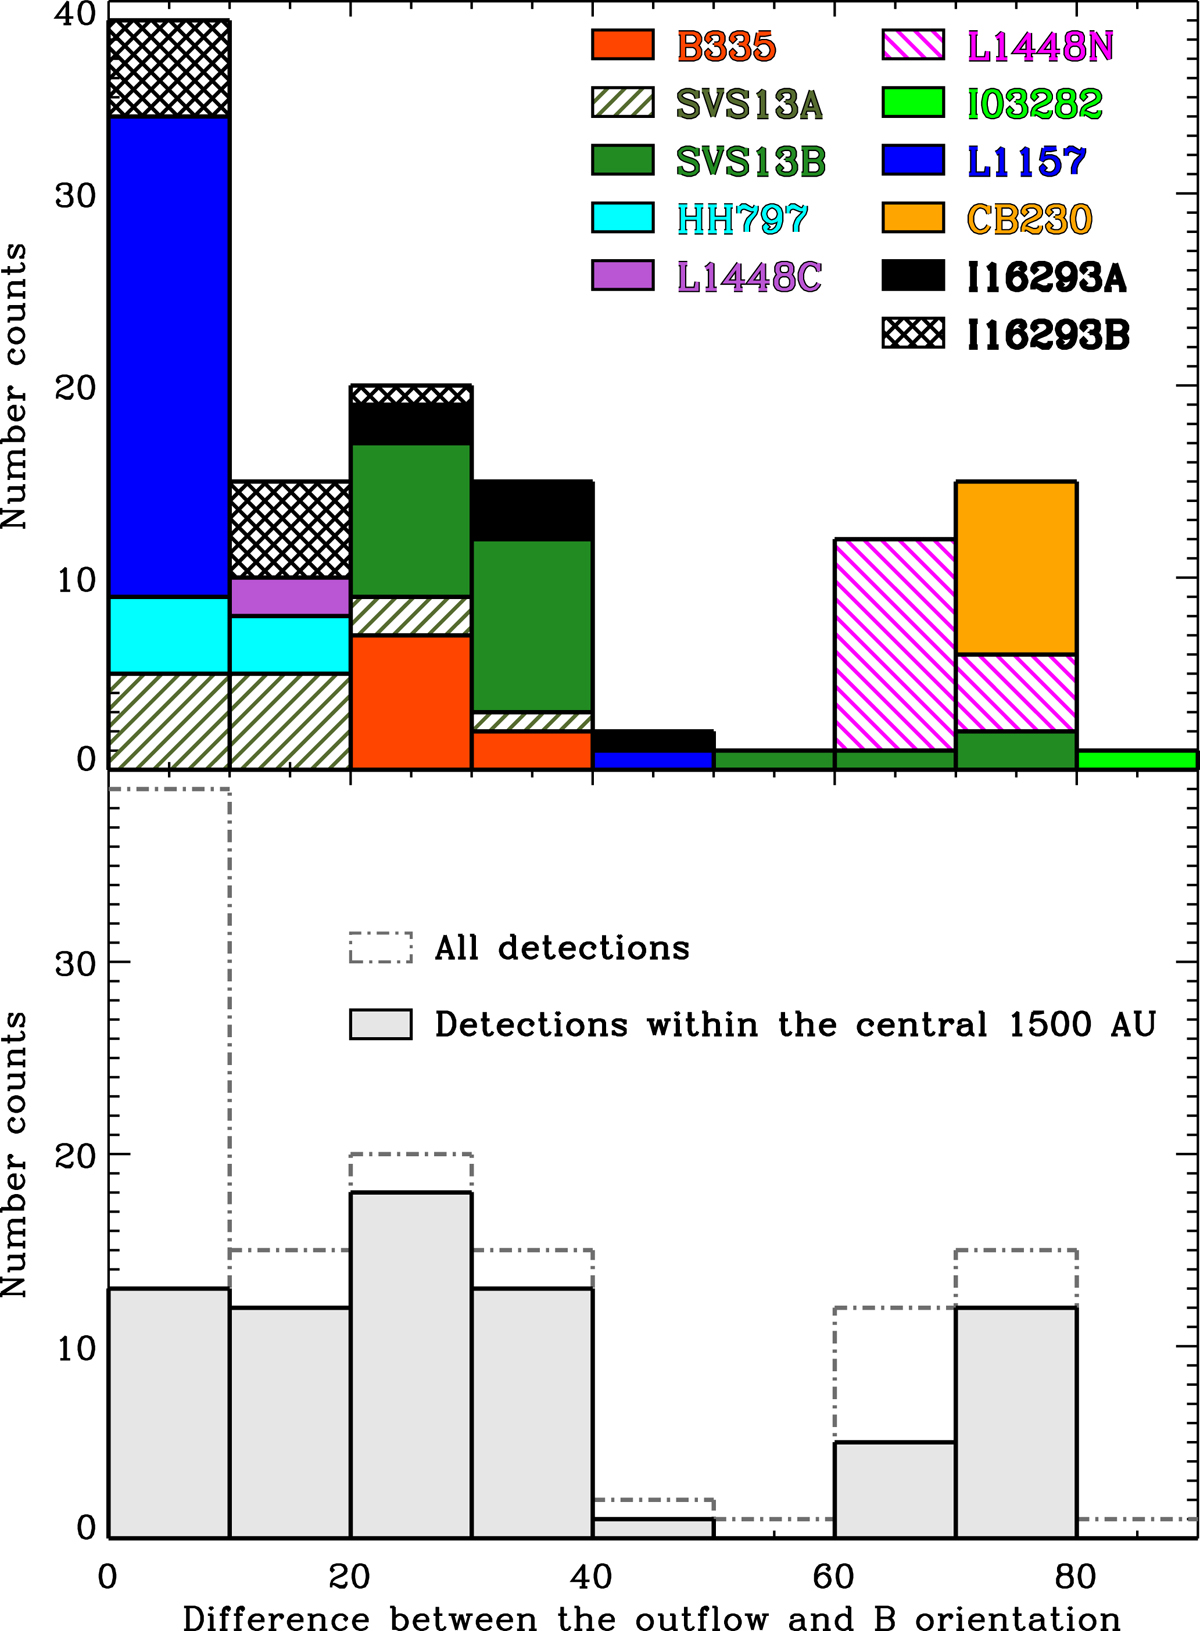
Histogram of the projected angles between the magnetic field and outflow direction. The data share a common synthesized beam size of about 5.5″ and are binned with pixels of 1.8″ for this analysis. The top panel shows the histogram color-coded per source while the bottom panel shows the global histogram (in white) with the histogram restricted to detections within the central 1500 au overlaid in gray.
Current usage metrics show cumulative count of Article Views (full-text article views including HTML views, PDF and ePub downloads, according to the available data) and Abstracts Views on Vision4Press platform.
Data correspond to usage on the plateform after 2015. The current usage metrics is available 48-96 hours after online publication and is updated daily on week days.
Initial download of the metrics may take a while.