Fig. 6.
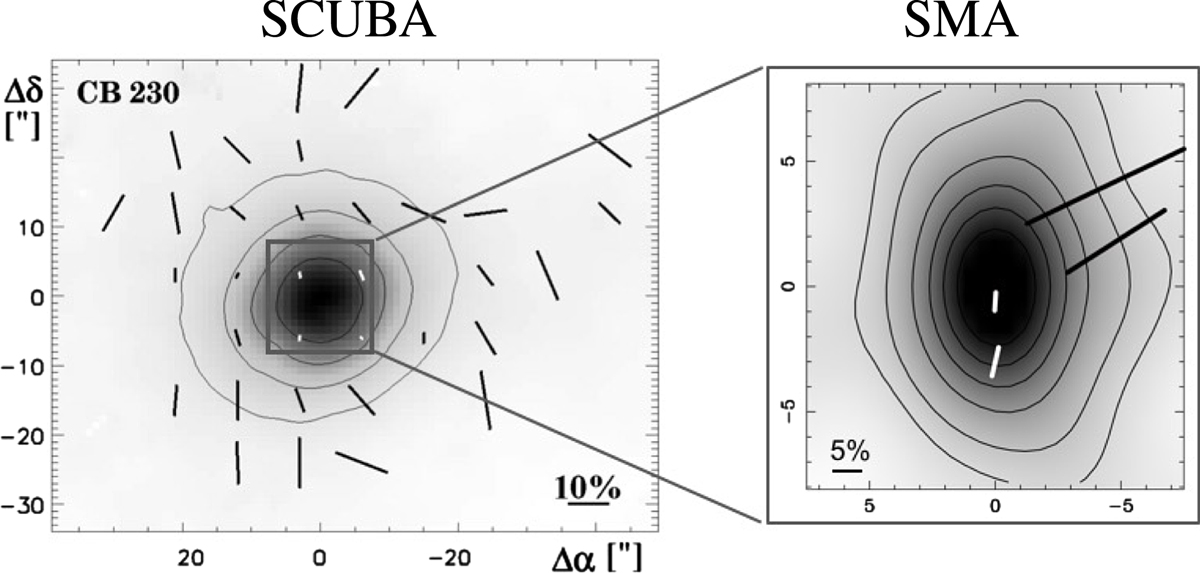
Left: SCUBA 0.85 mm continuum maps with polarization orientation overlaid from Wolf et al. (2003). The contour lines indicate 20%, 40%, 60%, and 80% of the maximum intensity. Right: zoom-in into the scales covered with the SMA at 0.87 mm. The contours are the same than in Fig. 2. For both, the bar length is proportional to the polarization fraction.
Current usage metrics show cumulative count of Article Views (full-text article views including HTML views, PDF and ePub downloads, according to the available data) and Abstracts Views on Vision4Press platform.
Data correspond to usage on the plateform after 2015. The current usage metrics is available 48-96 hours after online publication and is updated daily on week days.
Initial download of the metrics may take a while.