Fig. 5.
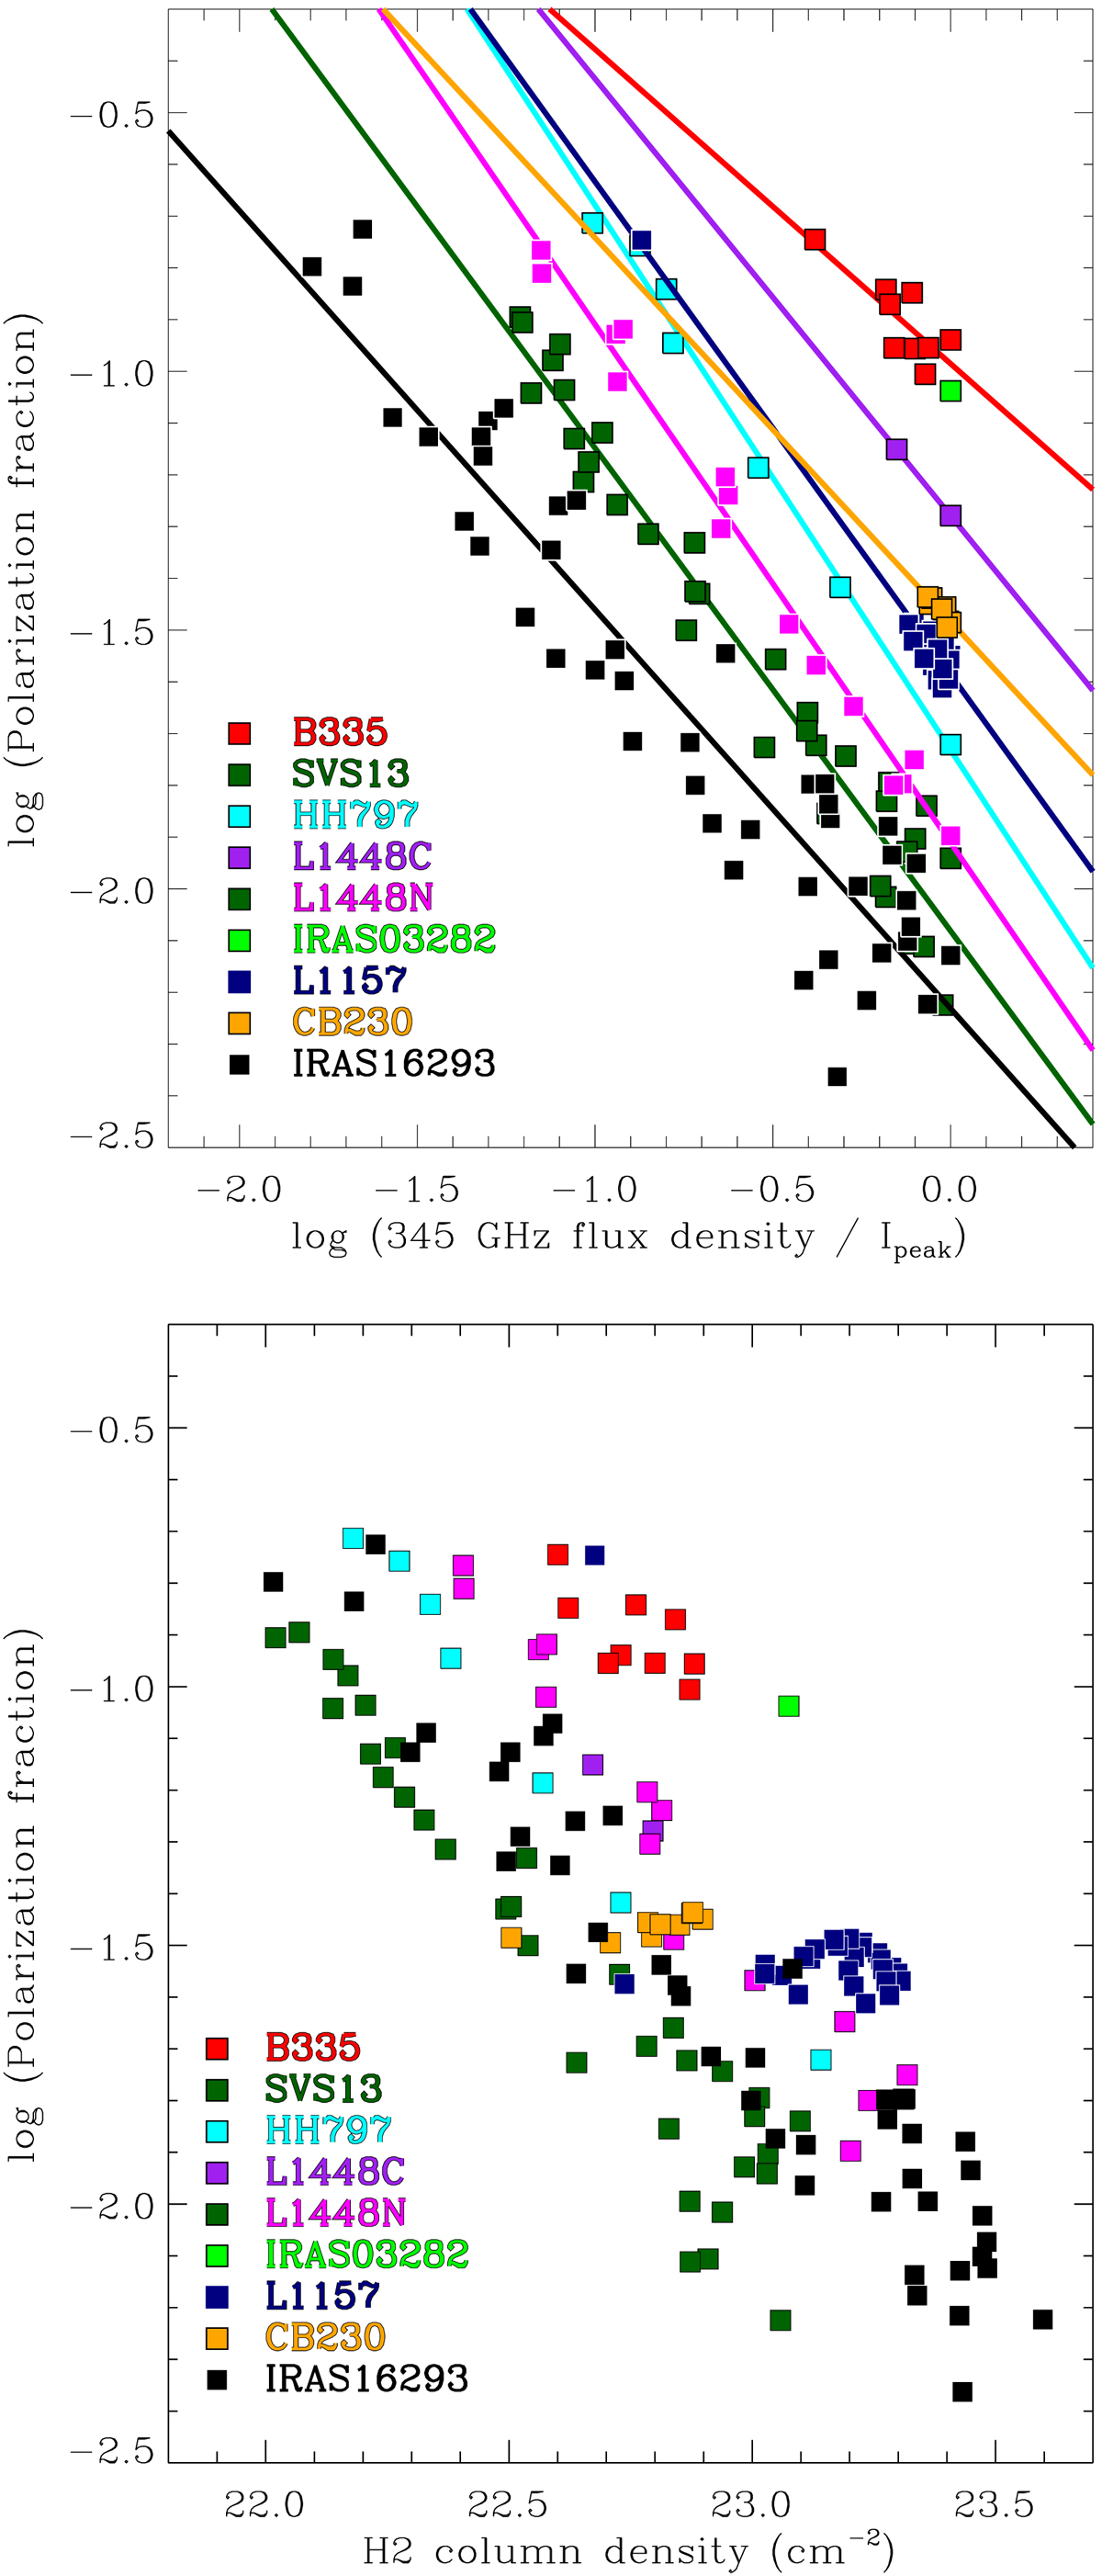
Polarization fractions as a function of Stokes I continuum intensities at 0.87 mm (top panel) or as a function of the H2 column densities (bottom panel). Maps have been regenerated to share a common synthesized beam of about 5.5″ and rebinned to have a grid with a common pixel size of 1.8″. The continuum flux densities plotted in the top panel are in units of Jy/beam but are normalized to the peak intensity for each object. The solid lines are the best fit to the function pfrac ∝ (I/Imax)a. The H2 column densities plotted in the bottom panel are in units of cm−2 and are derived using Eqs. (5) and (6).
Current usage metrics show cumulative count of Article Views (full-text article views including HTML views, PDF and ePub downloads, according to the available data) and Abstracts Views on Vision4Press platform.
Data correspond to usage on the plateform after 2015. The current usage metrics is available 48-96 hours after online publication and is updated daily on week days.
Initial download of the metrics may take a while.