Fig. 3.
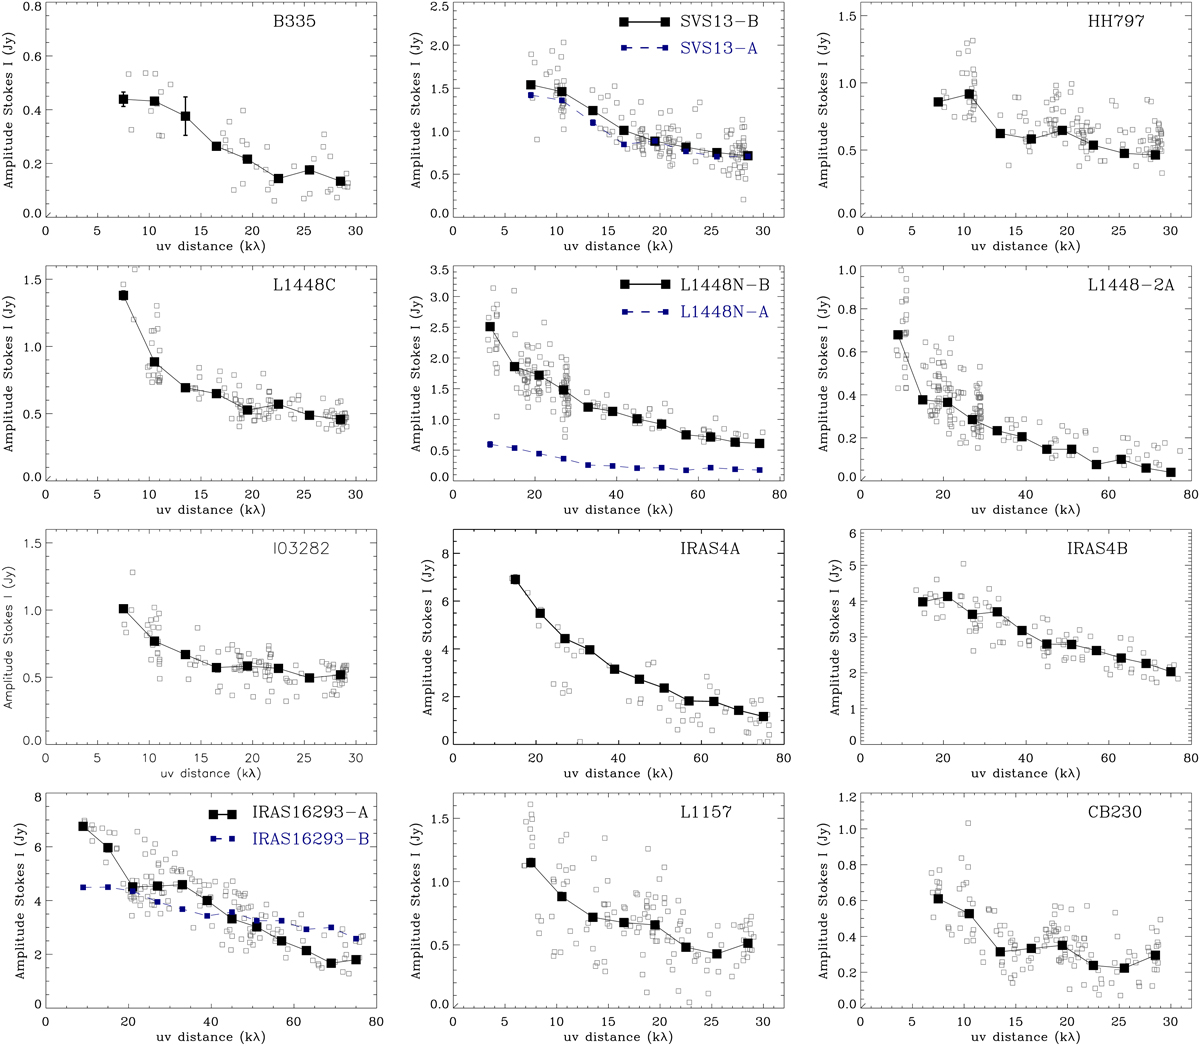
Stokes I visibility amplitude as a function of uv distance (in units of kλ). The open squares are the amplitudes of the visibilities channel-averaged and time-averaged every 120s. The black squares are derived averaging these amplitudes of the visibilities in 6 kλ bins for L1448N, L1448-2A, NGC 1333 IRAS4A, IRAS4B, and IRAS16293 and 3 kλ bins for the other sources. For the wide-binary L1448N, SVS13, and IRAS16293, we model and isolate the two sources separately. For IRAS4B, we also isolate and remove NGC 1333 IRAS4B2 from the visibility data.
Current usage metrics show cumulative count of Article Views (full-text article views including HTML views, PDF and ePub downloads, according to the available data) and Abstracts Views on Vision4Press platform.
Data correspond to usage on the plateform after 2015. The current usage metrics is available 48-96 hours after online publication and is updated daily on week days.
Initial download of the metrics may take a while.