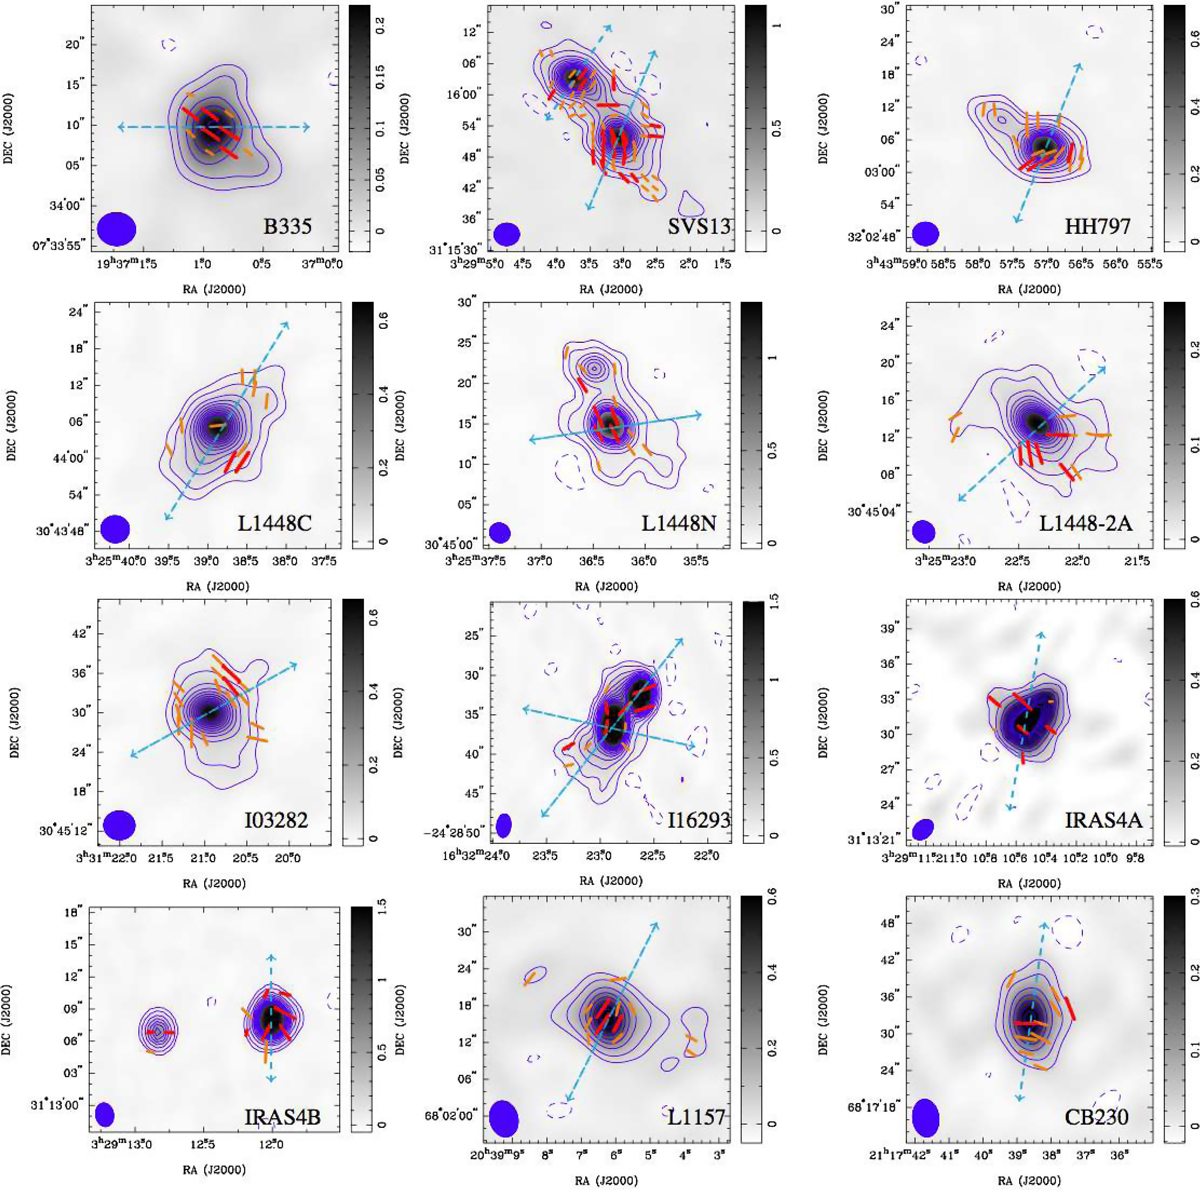
Fig. 2.

SMA 850 μm Stokes I continuum maps. Color scales are in mJy/beam. Contours at [−3, 5, 10, 20, 30, 40, 50, 60, 70, 80, 90, 100] σ appear in blue. The filled ellipses in the bottom left corner indicate the synthesized beam of the SMA maps. Their sizes are reported in Table 3. The blue arrows indicate the outflow direction. The B orientations (derived from the polarization angles assuming a 90° rotation) are overlaid on the Stokes I map. Red bars show >3σ detections. We also indicate the >2σ detections with orange bars but these detections are not used for this analysis
Current usage metrics show cumulative count of Article Views (full-text article views including HTML views, PDF and ePub downloads, according to the available data) and Abstracts Views on Vision4Press platform.
Data correspond to usage on the plateform after 2015. The current usage metrics is available 48-96 hours after online publication and is updated daily on week days.
Initial download of the metrics may take a while.


