Fig. 1.
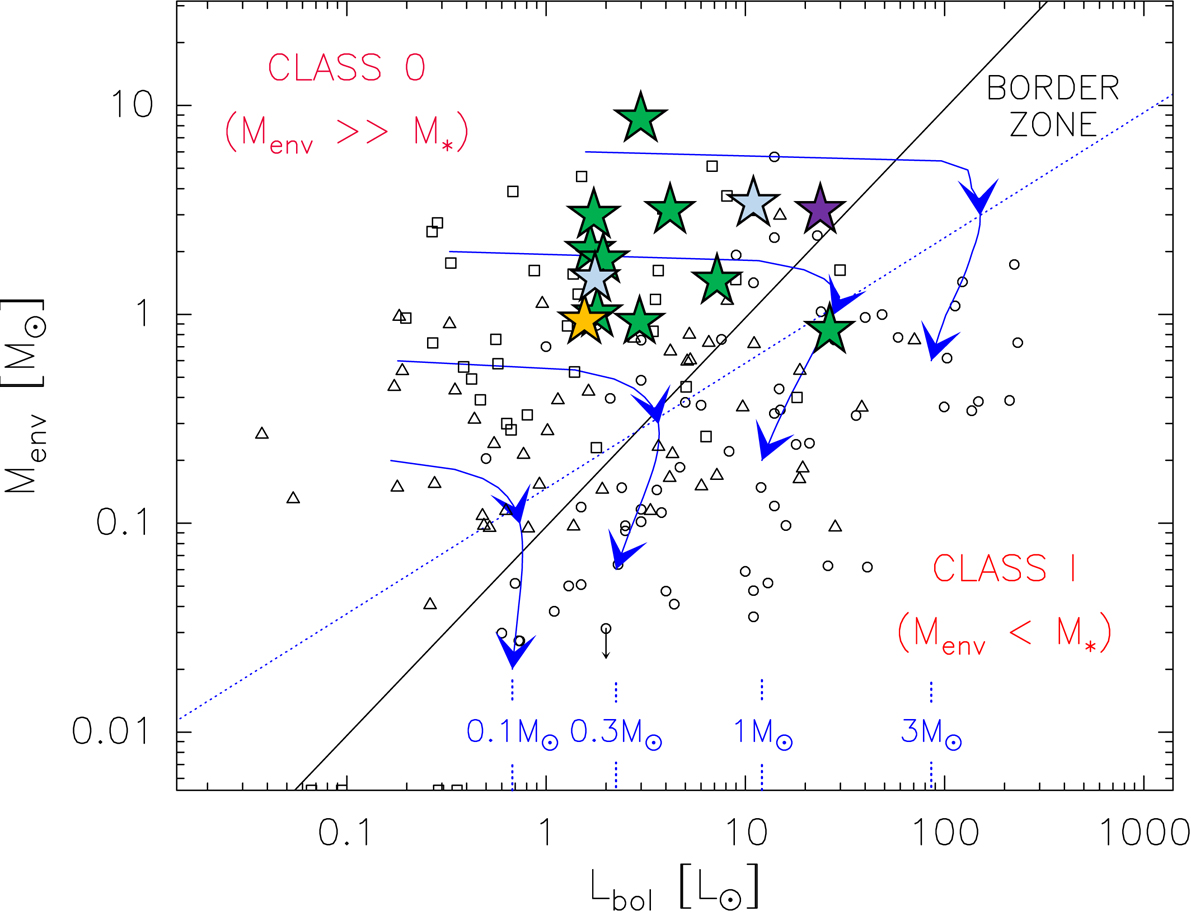
Envelope mass vs. bolometric luminosity diagram from Andre et al. (2000) and Maury et al. (2011). The small black squares and triangles are Class 0 and I protostars detected in the Aquila rift, Ophiuchus, Perseus, and Orion regions (Bontemps et al. 1996; Motte & André 2001; Andre et al. 2000; Maury et al. 2011; Sadavoy et al. 2014). The lines indicate the conceptual border zone between the Class 0 and Class I stage, with Menv ∝ Lbol for the dashed line and ![]() for the dotted line. Blue lines with arrows represent protostellar evolutionary tracks, computed for final stellar masses of 0.1, 0.3, 1, and 3M⊙; the evolution proceeds from top left (objects with large envelope masses slowly accreting) to bottom (the envelope mass and the accretion luminosity are rapidly decreasing). Our sample is overlaid with the positions of protostars in our sample: B335 in yellow, IRAS16293 in purple, Perseus sources in green, and Cepheus sources in light blue. The sample only contains low-mass Class 0 protostars, except for SVS13-A. The Menv and Lbol are from Massi et al. (2008) for CB230, Launhardt et al. (2013) for B335, Crimier et al. (2010) for IRAS16293, Sadavoy et al. (2014), Ladjelate et al. (in prep.), and Maury et al. (in prep.) for the rest of the sources.
for the dotted line. Blue lines with arrows represent protostellar evolutionary tracks, computed for final stellar masses of 0.1, 0.3, 1, and 3M⊙; the evolution proceeds from top left (objects with large envelope masses slowly accreting) to bottom (the envelope mass and the accretion luminosity are rapidly decreasing). Our sample is overlaid with the positions of protostars in our sample: B335 in yellow, IRAS16293 in purple, Perseus sources in green, and Cepheus sources in light blue. The sample only contains low-mass Class 0 protostars, except for SVS13-A. The Menv and Lbol are from Massi et al. (2008) for CB230, Launhardt et al. (2013) for B335, Crimier et al. (2010) for IRAS16293, Sadavoy et al. (2014), Ladjelate et al. (in prep.), and Maury et al. (in prep.) for the rest of the sources.
Current usage metrics show cumulative count of Article Views (full-text article views including HTML views, PDF and ePub downloads, according to the available data) and Abstracts Views on Vision4Press platform.
Data correspond to usage on the plateform after 2015. The current usage metrics is available 48-96 hours after online publication and is updated daily on week days.
Initial download of the metrics may take a while.