Fig. 7.
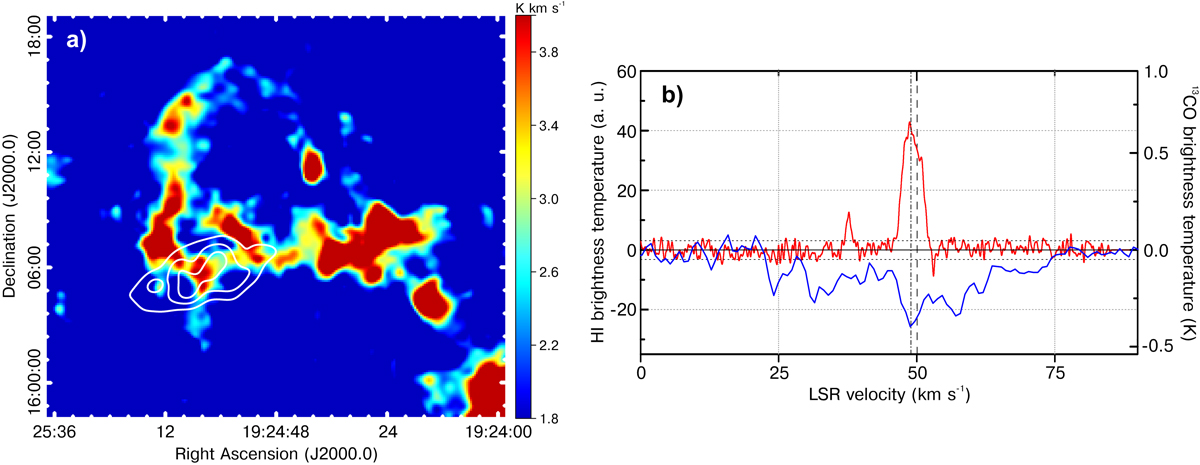
Panel a: emission of 13CO(J = 1–0) in the Galactic complex associated with the source G51.04 and the star forming activity regions shown in Fig. 1. The image was obtained by integrating the molecular line emission in the velocity range from 40 to 52 km s−1. The contours trace the 74 MHz radio continuum emission from G51.04 at 0.34, 0.58, and 0.78 Jy beam−1. Panel b: 13CO emission (red curve) and HI absorption (blue curve) spectra towards the identified molecular component, which are roughly coincident in projection with the radio emission from G51.04. Horizontal dotted lines mark the rms noise of the HI absorption spectrum. The dash-triple-dot line indicates the velocity of the cloud, while the dashed line marks the velocity of the tangent point. The spectral features allow us to establish a lower kinematic distance limit of ~6 kpc to the cloud.
Current usage metrics show cumulative count of Article Views (full-text article views including HTML views, PDF and ePub downloads, according to the available data) and Abstracts Views on Vision4Press platform.
Data correspond to usage on the plateform after 2015. The current usage metrics is available 48-96 hours after online publication and is updated daily on week days.
Initial download of the metrics may take a while.