Free Access
Fig. 6.
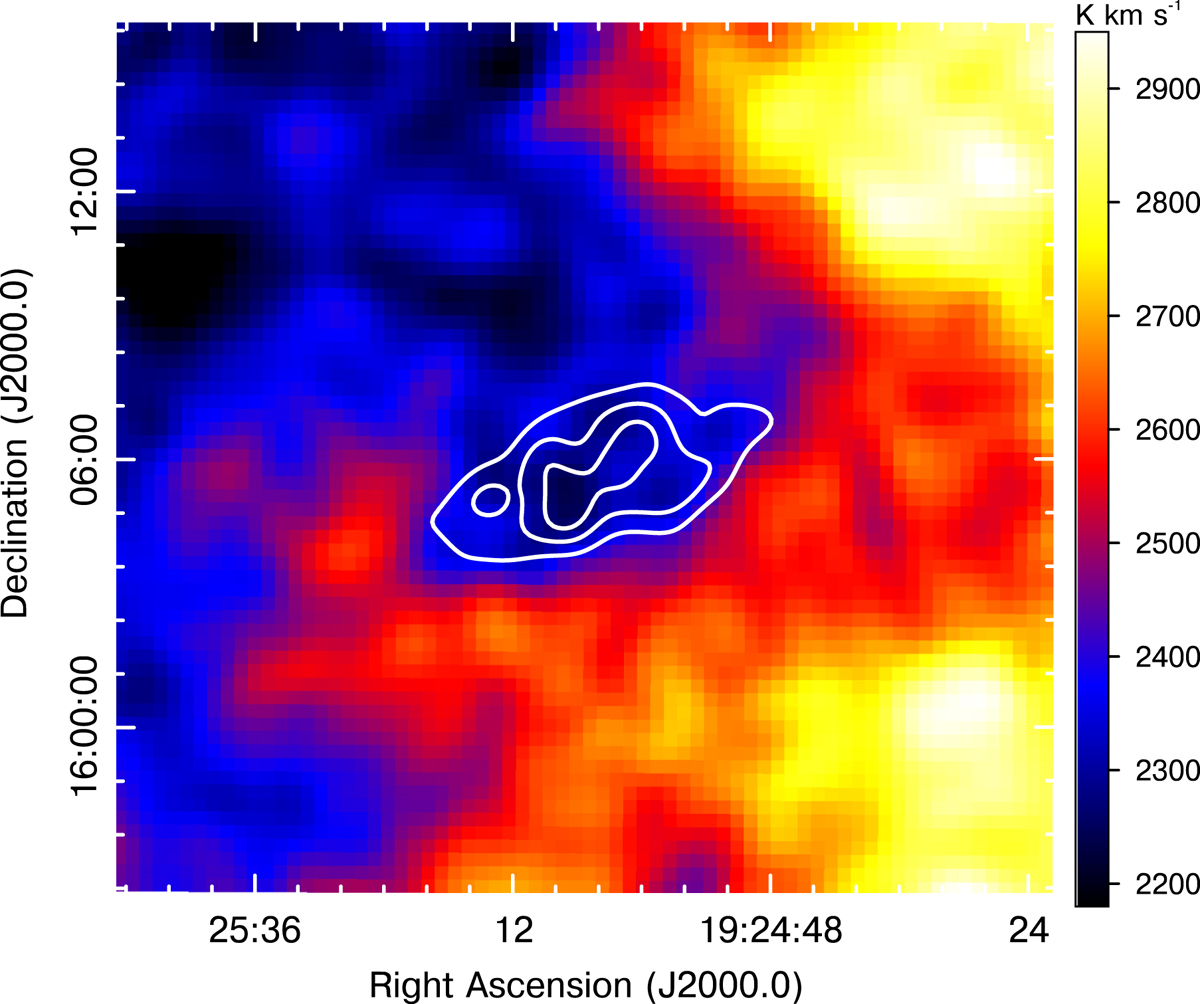
21 cm line emission in the direction of G51.04. The map corresponds to the integration of the neutral gas from 25 to 55 km s−1. The 0.34, 0.58, and 0.78 Jy beam−1 contours from the 75″resolution 74 MHz VLSSr image are included to facilitate the comparison between G51.04 and its surroundings.
Current usage metrics show cumulative count of Article Views (full-text article views including HTML views, PDF and ePub downloads, according to the available data) and Abstracts Views on Vision4Press platform.
Data correspond to usage on the plateform after 2015. The current usage metrics is available 48-96 hours after online publication and is updated daily on week days.
Initial download of the metrics may take a while.