Fig. 4.
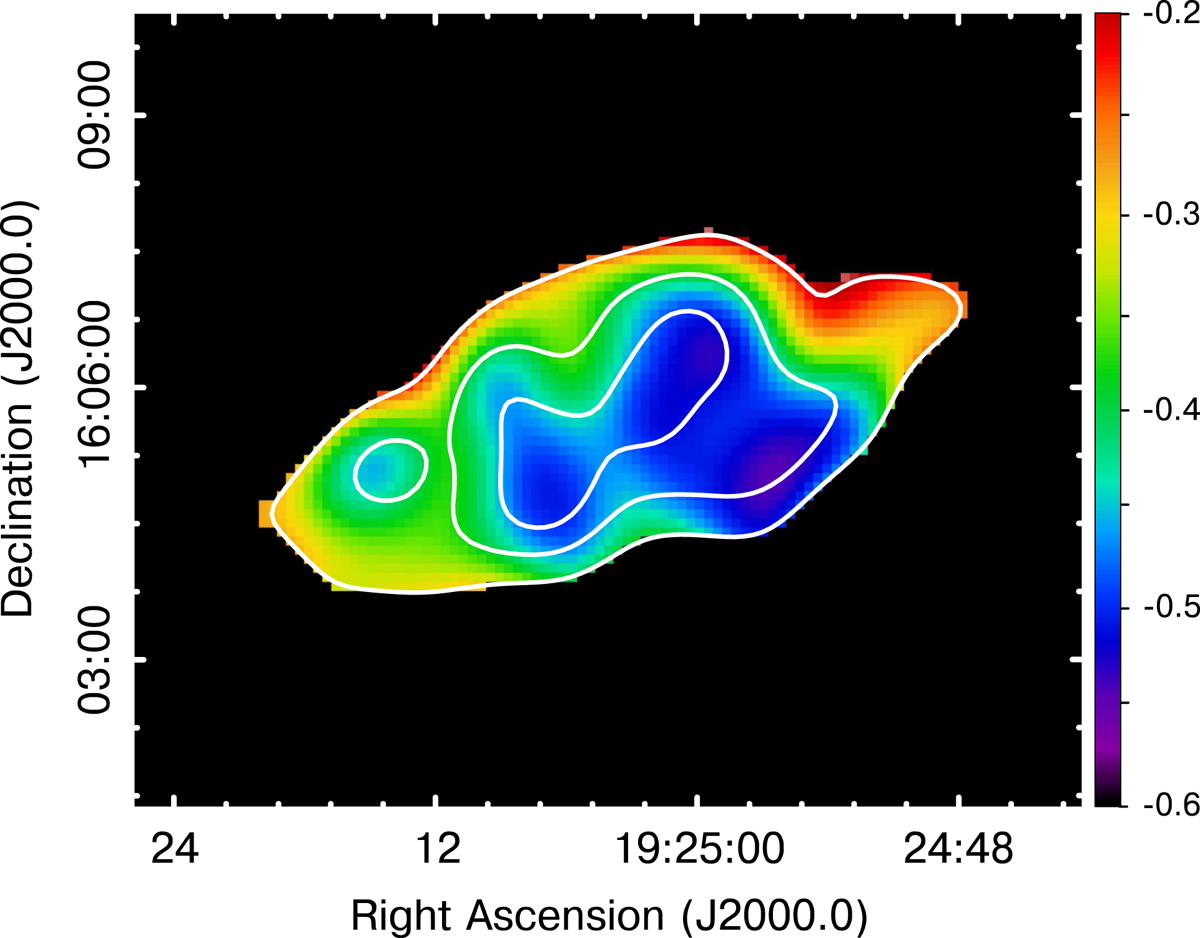
Spatial spectral index distribution in the SNR G51.04 calculated between 74 and 1400 MHz using the VLSSr and THOR + VGPS images. To create this spectral map, which has a resolution of 75″, the input images at 74 and 1400 MHz were masked at 3.5σ and 3σ of their respective noise levels. The superimposed contours correspond to the 74 MHz emission at levels 0.34, 0.58, and 0.78 Jy beam−1.
Current usage metrics show cumulative count of Article Views (full-text article views including HTML views, PDF and ePub downloads, according to the available data) and Abstracts Views on Vision4Press platform.
Data correspond to usage on the plateform after 2015. The current usage metrics is available 48-96 hours after online publication and is updated daily on week days.
Initial download of the metrics may take a while.