Fig. 1.
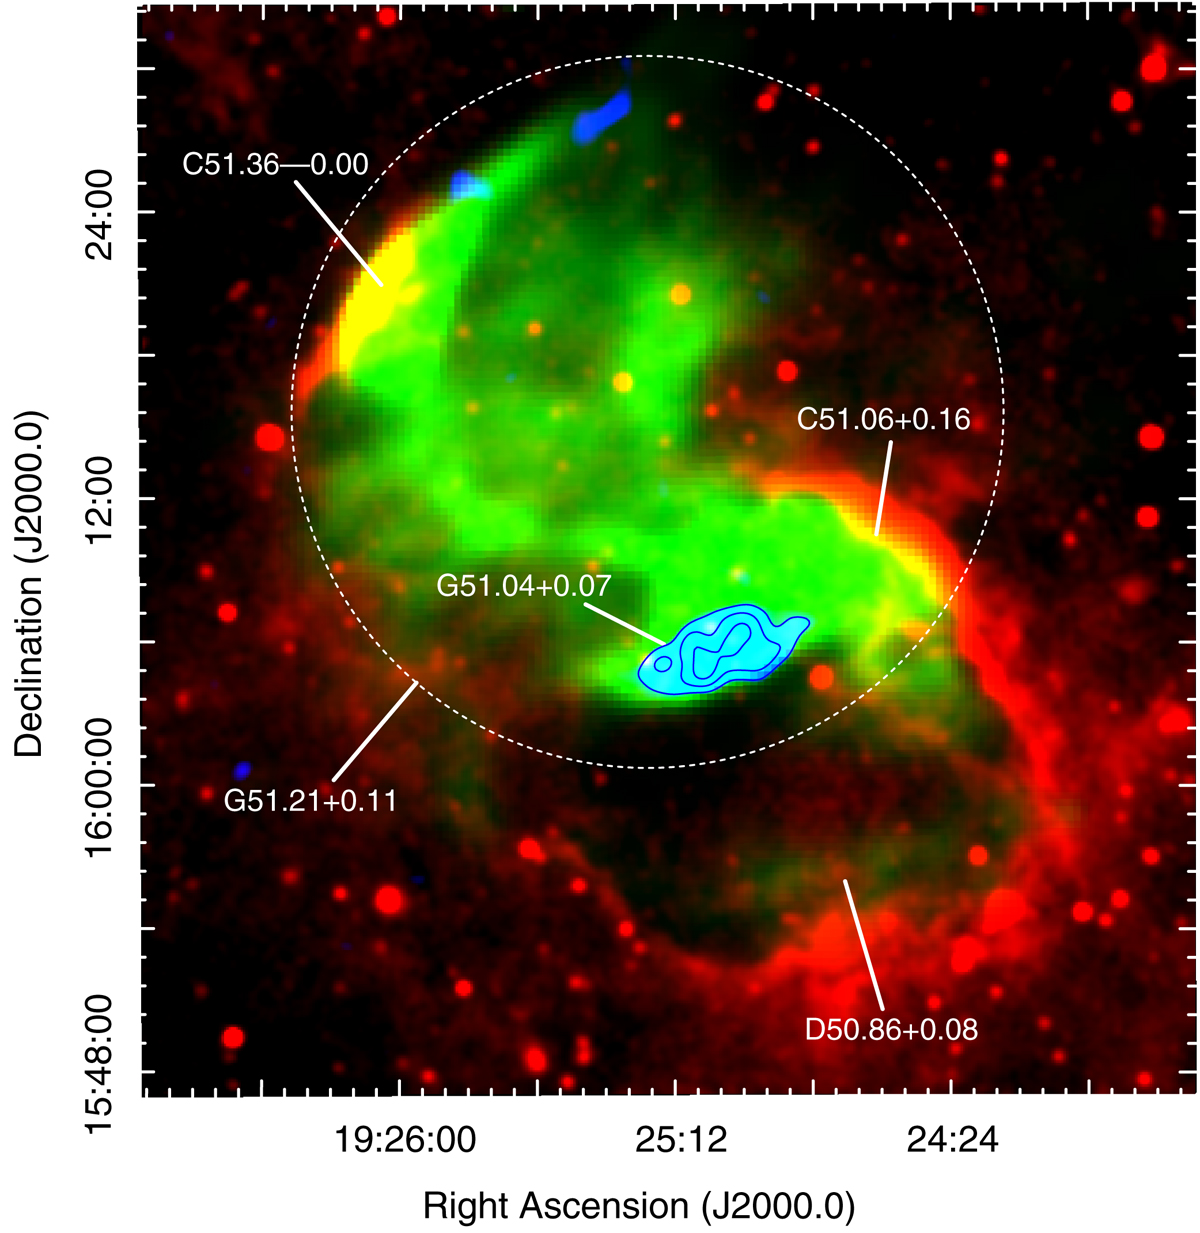
Colour composite image showing the spatial correspondence between the mid-infrared emission as observed by MSX at 8 μm (in red), and the radio continuum emission at 74 (in blue) and 1420 MHz (in green) from the VLSSr and VGPS, respectively. Thermal emission features are traced in yellow and green, while nonthermal radiation is visible in cyan. The overlaid contours tracing the 74 MHz nonthermal emission from the new SNR G51.04+0.07 are at 0.34, 0.58, and 0.78 Jy beam−1. The dotted circle indicates the size and position of the previously proposed SNR candidate G51.21+0.11 (Anderson et al. 2017). The HII regions in the field are also labelled.
Current usage metrics show cumulative count of Article Views (full-text article views including HTML views, PDF and ePub downloads, according to the available data) and Abstracts Views on Vision4Press platform.
Data correspond to usage on the plateform after 2015. The current usage metrics is available 48-96 hours after online publication and is updated daily on week days.
Initial download of the metrics may take a while.