Fig. 8
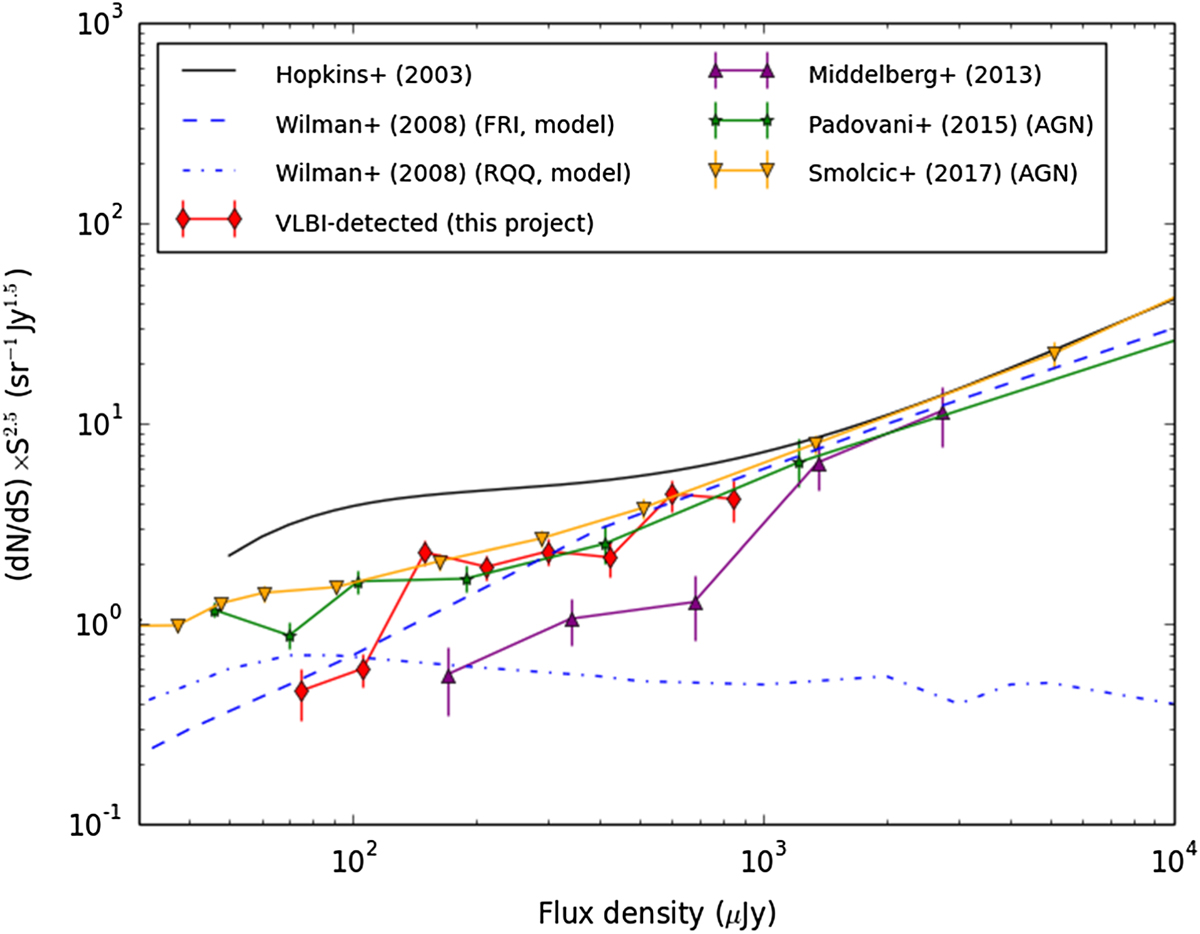
Euclidean-normalised source counts comparison to the literature. The black line represents the polynomial fit to the total source counts from Hopkins et al. (2003). The dashed and dot-dashed blue lines represent the predicted source counts of Fanaroff-Riley class I (FRI) radio galaxies and radio-quiet quasars (RQQ), respectively, by Wilman et al. (2008). The red diamonds represent the lower limits for the source counts of our VLBI-detected sources. The purple triangles represent the source counts of the VLBI-detected sources by Middelberg et al. (2013). The green stars represent the AGN source counts from Padovani et al. (2015). The orange inverted triangles represent the AGN source counts from Smolčić et al. (2017a).
Current usage metrics show cumulative count of Article Views (full-text article views including HTML views, PDF and ePub downloads, according to the available data) and Abstracts Views on Vision4Press platform.
Data correspond to usage on the plateform after 2015. The current usage metrics is available 48-96 hours after online publication and is updated daily on week days.
Initial download of the metrics may take a while.