Fig. 7
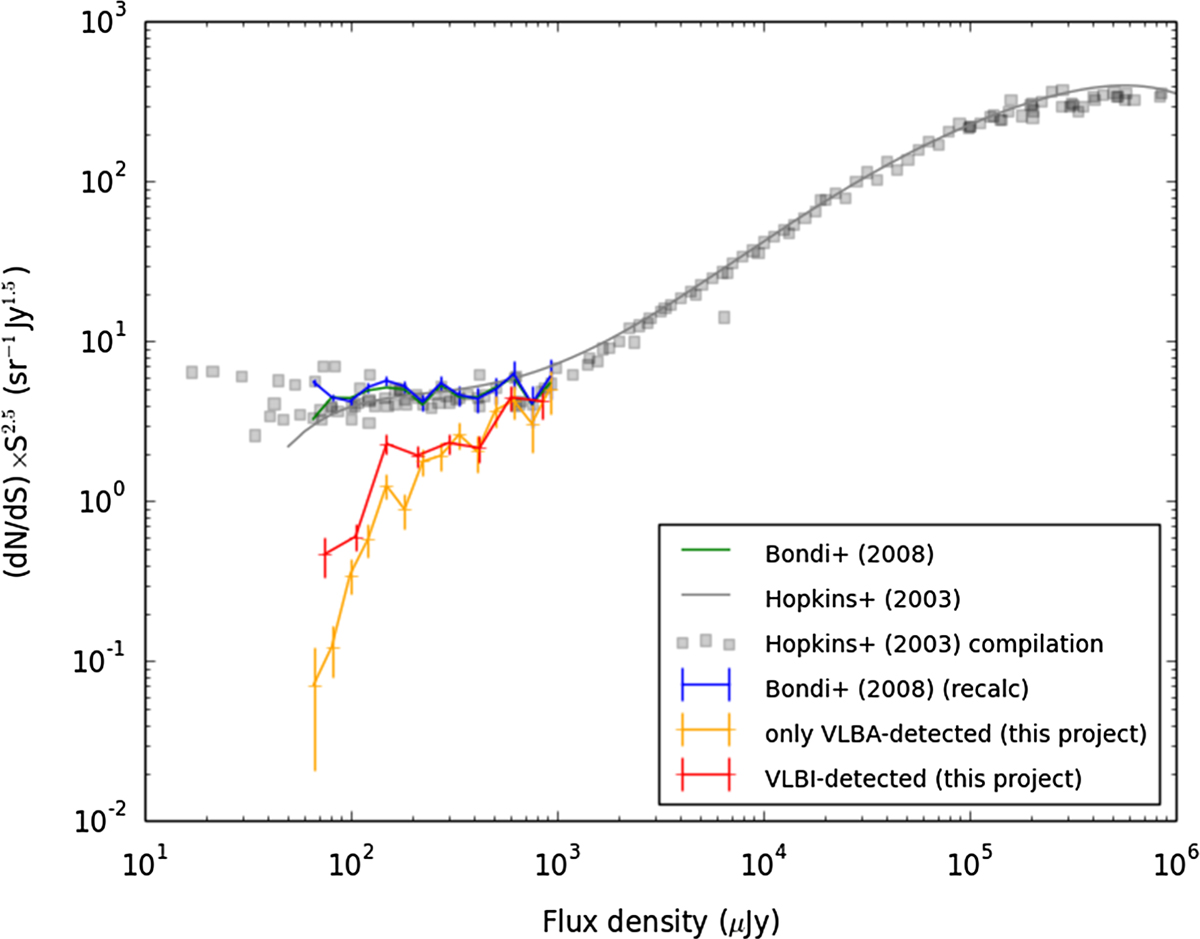
1.4 GHz Euclidean-normalised source counts (lower limits) of the VLBI-detected sources (red line) of the COSMOS field. We have used the associated VLA flux densities of the VLBI detected sources. The orange line represents the derived source counts (lower limits) using only the sample of VLBA detected sources. The green line represents the source counts from Bondi et al. (2008) and the blue line is the reconstruction of their results using the same procedure as for the VLBI-detected sources. The grey squares represent the data from Hopkins et al. (2003) and the grey line their polynomial fit.
Current usage metrics show cumulative count of Article Views (full-text article views including HTML views, PDF and ePub downloads, according to the available data) and Abstracts Views on Vision4Press platform.
Data correspond to usage on the plateform after 2015. The current usage metrics is available 48-96 hours after online publication and is updated daily on week days.
Initial download of the metrics may take a while.