Fig. 6
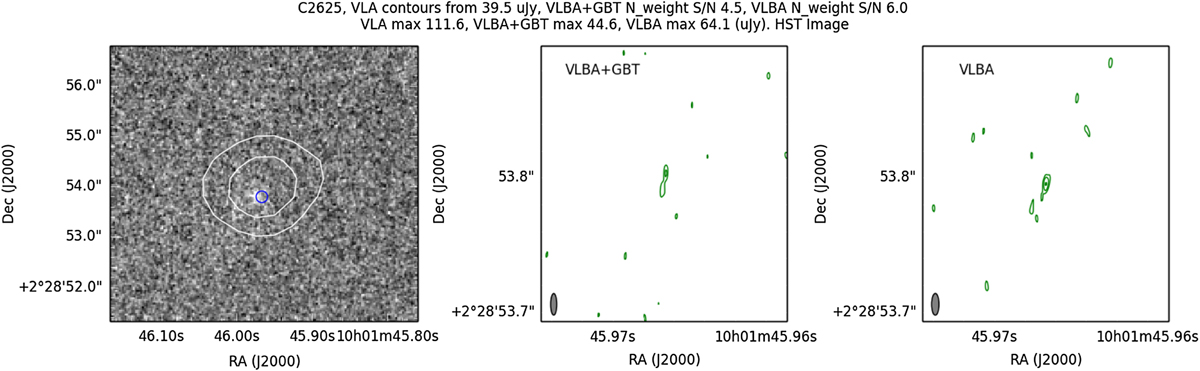
Optical counterpart and radio contour plots of C2625. The header contains: i) The source name used in the present project; ii) the rms noise value at which the VLA contours start; iii) The VLBA+GBT naturally-weighted image S/N; iv) The VLBA naturally-weighted image S/N; v) The VLA peak flux density (in μJy); vi) The VLBA+GBT peak flux density (in μJy); vii) The VLBA peak flux density (in μJy). Left panel: HST image of the optical counterpart (background greyscale image) (Koekemoer et al. 2007; Massey et al. 2010). The white contours represent the VLA contours of the source, starting at four times the rms noise level of the VLA image and increasing by a factor of two. The blue circle represents the VLBA detection position. Middle panel: green contours represent the VLBA+GBT contours of the source, starting at three times the rms noise level of the naturally-weighted image and increasing by a factor of ![]() . Right panel: green contours represent the VLBA detection contours, starting at three times the rms noise level of the naturally-weighted image and increasing by a factor of
. Right panel: green contours represent the VLBA detection contours, starting at three times the rms noise level of the naturally-weighted image and increasing by a factor of ![]() .
.
Current usage metrics show cumulative count of Article Views (full-text article views including HTML views, PDF and ePub downloads, according to the available data) and Abstracts Views on Vision4Press platform.
Data correspond to usage on the plateform after 2015. The current usage metrics is available 48-96 hours after online publication and is updated daily on week days.
Initial download of the metrics may take a while.