Fig. 5
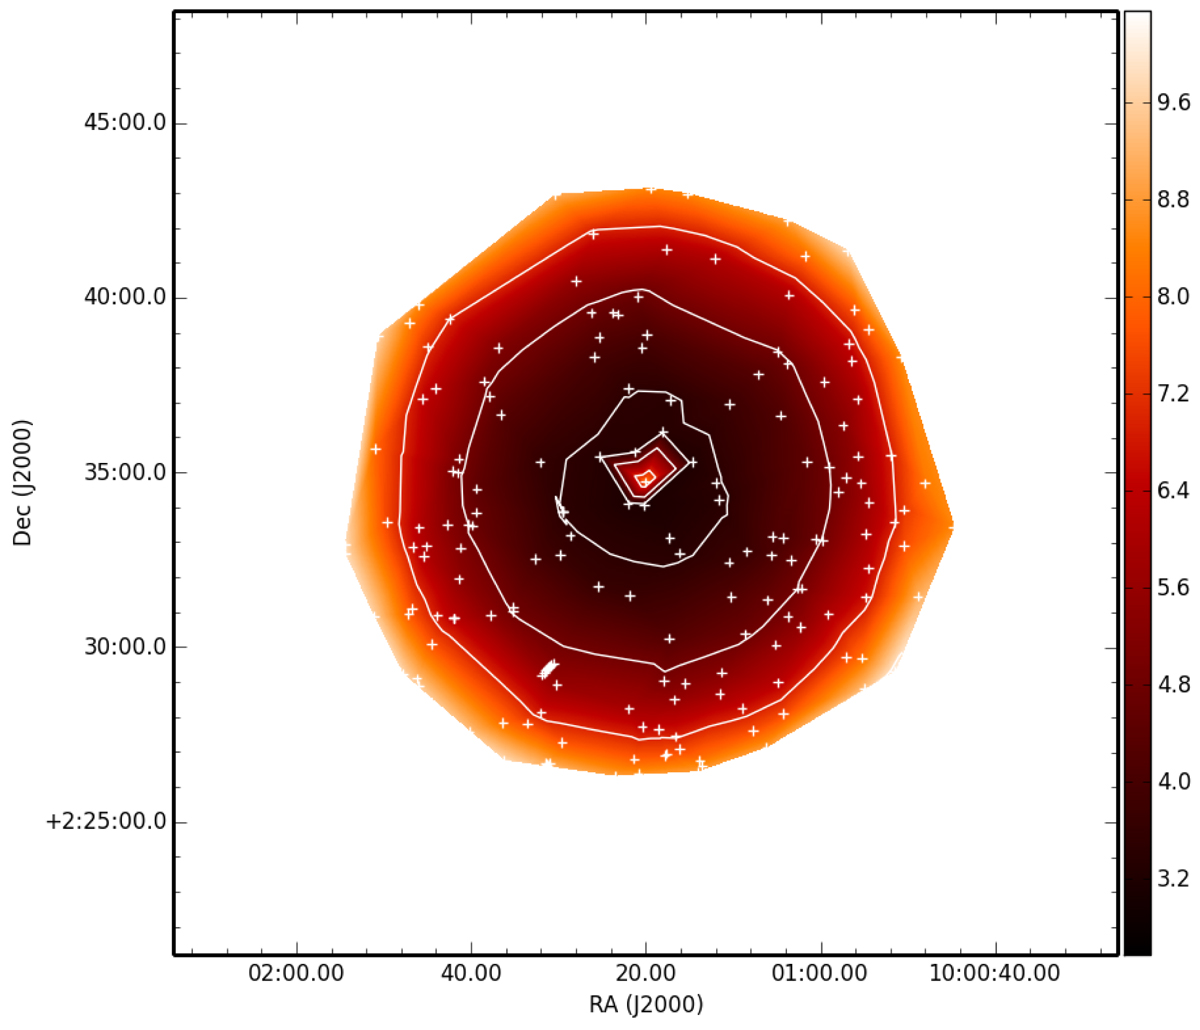
Sensitivity map of the VLBA+GBT observations. The colour bar represents the rms noise values in μJy/beam. The white crosses represent the target positions. White contours were drawn at 3.5, 4.9, 7, and 9.9 μJy/beam. The high rms in the centre of the map is a result of the calibration process not being able to completely minimise the sidelobe level associated with the strong source at this location.
Current usage metrics show cumulative count of Article Views (full-text article views including HTML views, PDF and ePub downloads, according to the available data) and Abstracts Views on Vision4Press platform.
Data correspond to usage on the plateform after 2015. The current usage metrics is available 48-96 hours after online publication and is updated daily on week days.
Initial download of the metrics may take a while.