Fig. 4
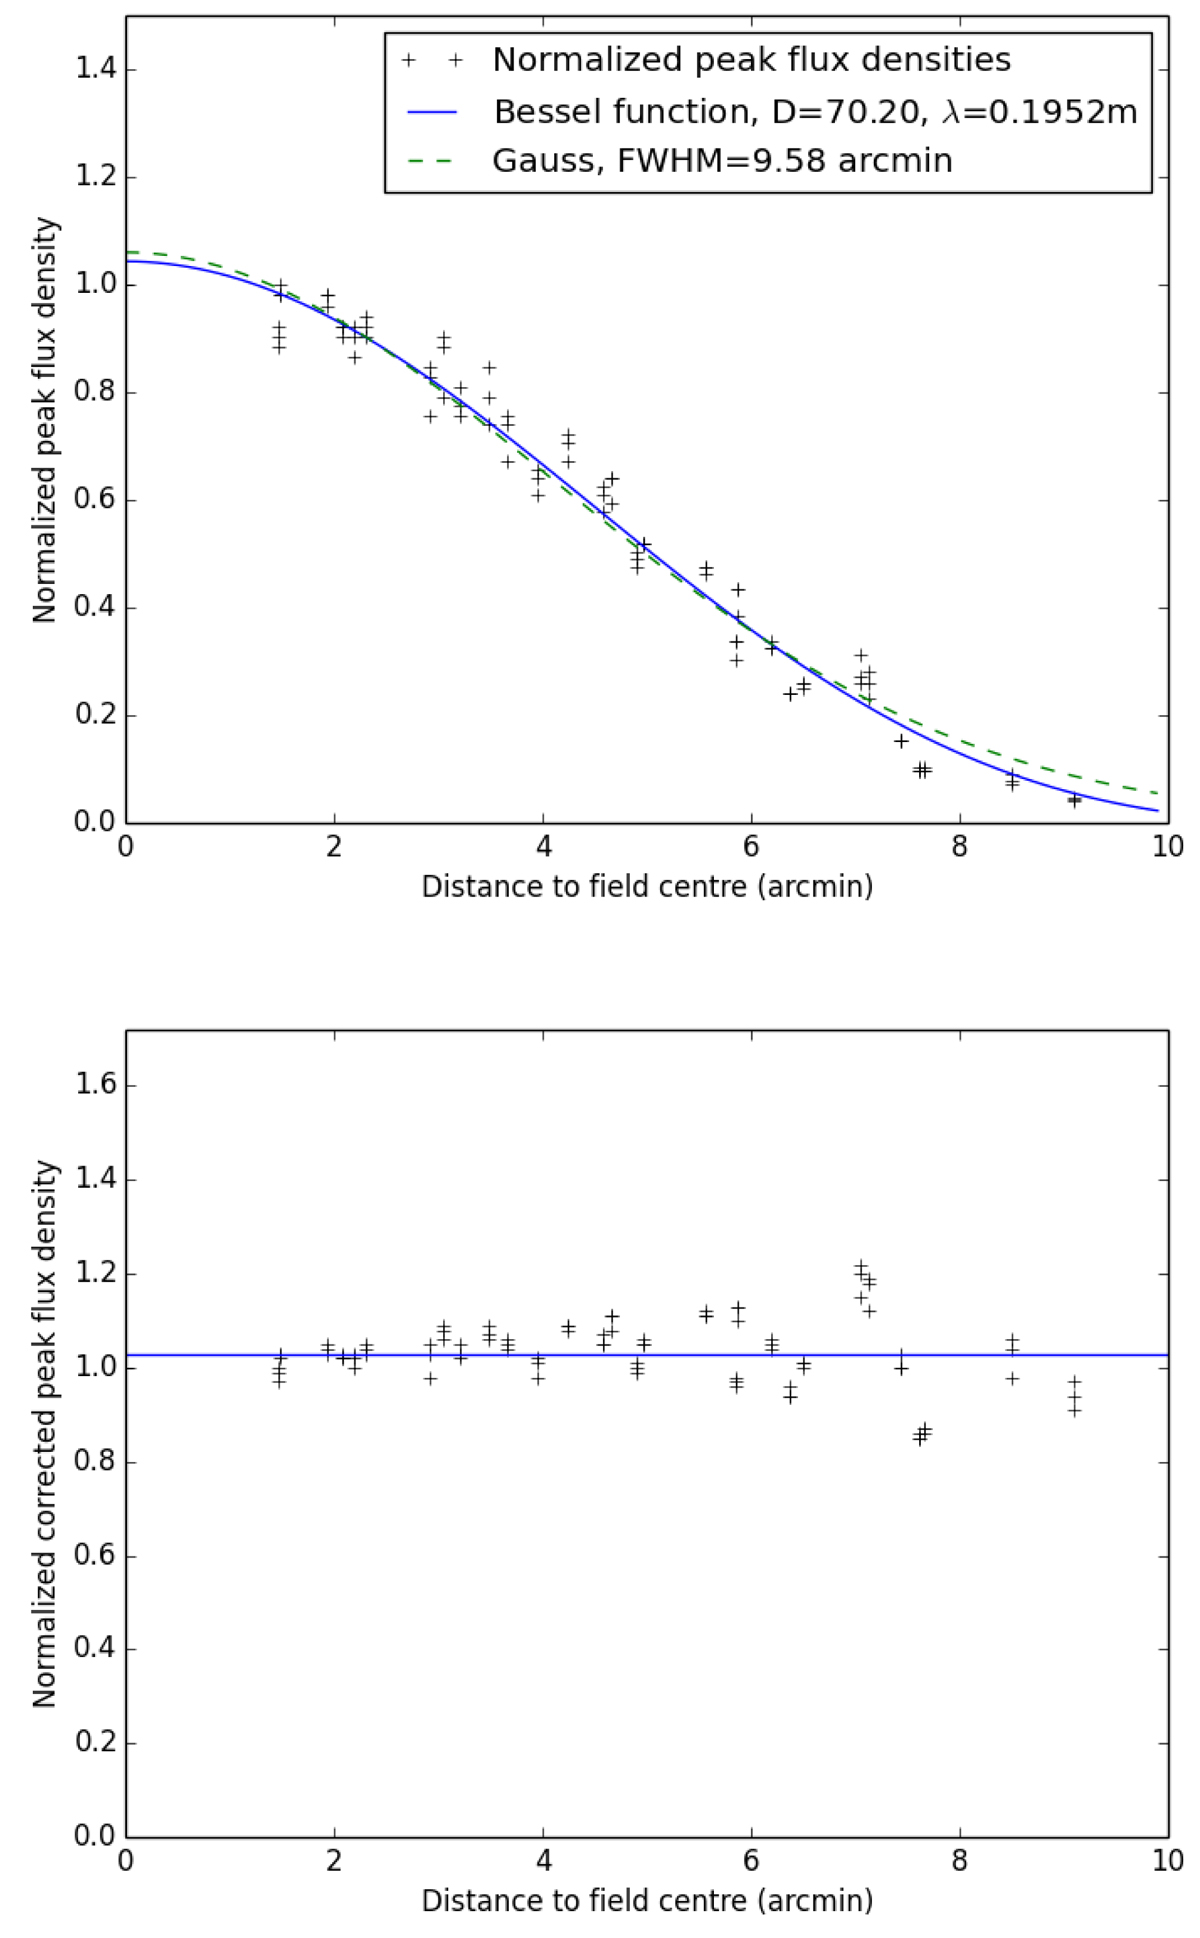
Top: normalised peak flux densities of 3C 84 measured by three baselines between the GBT and a VLBA station as a function of the distance to the field centre. The blue solid line represents our fit to the data for an Airy disk and the green dashed line for a Gaussian. Bottom: the normalised peak flux densities of 3C 84, after applying the primary beam correction, as a function of the distance to the field centre. The blue solid line represents the mean of the values, which is almost one. The standard deviation is 0.07.
Current usage metrics show cumulative count of Article Views (full-text article views including HTML views, PDF and ePub downloads, according to the available data) and Abstracts Views on Vision4Press platform.
Data correspond to usage on the plateform after 2015. The current usage metrics is available 48-96 hours after online publication and is updated daily on week days.
Initial download of the metrics may take a while.