Fig. 15
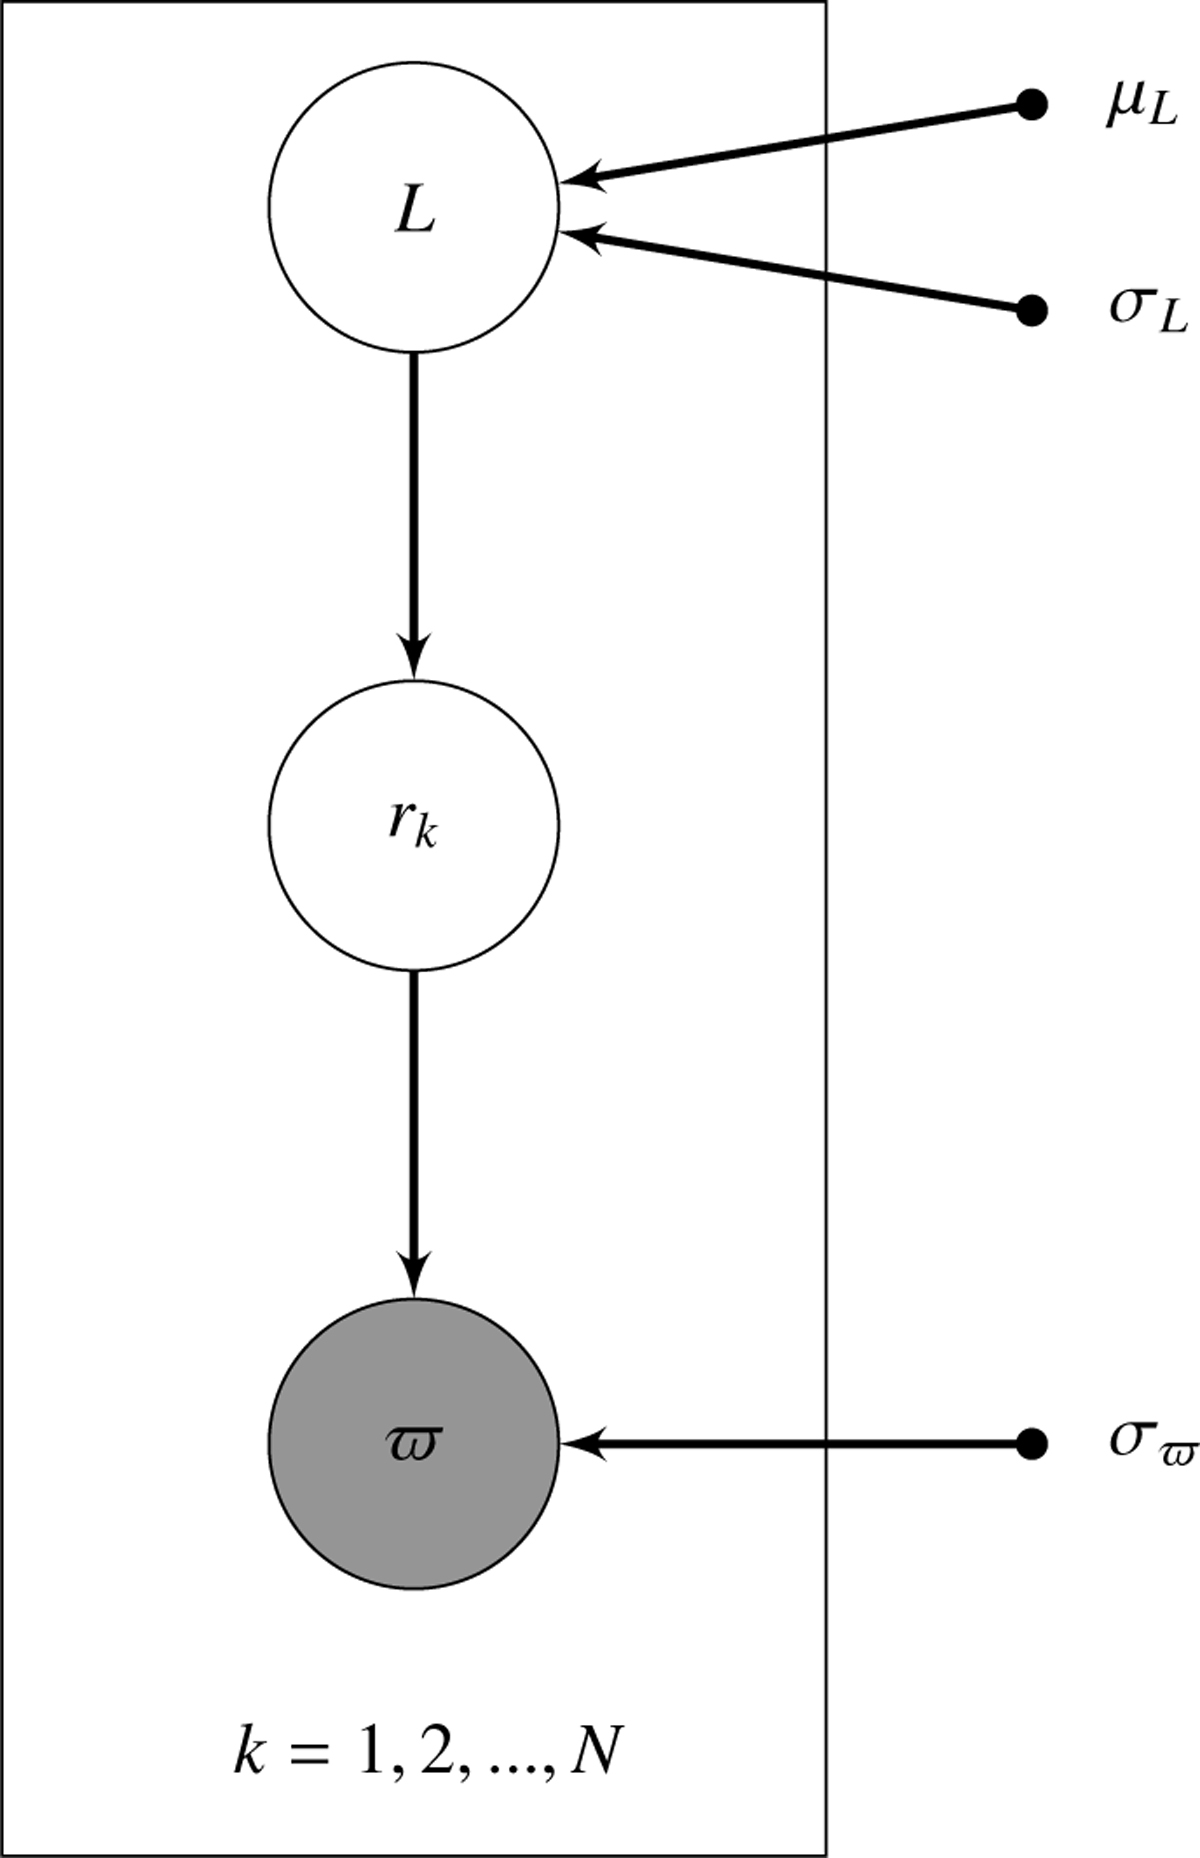
Directed acyclic graph that represents a hierarchical Bayesian model of a set of N parallax measurements characterised by uncertainties σϖ and true distances drawn from an exponentially decreasing density distribution of distances (see Eq. (18)). The scale length of the exponential decrease, L, is itself a model parameter that we can infer from the sample. Its prior is defined in this case for the sake of simplicity as a Gaussian distribution of mean μL and standard deviation σL.
Current usage metrics show cumulative count of Article Views (full-text article views including HTML views, PDF and ePub downloads, according to the available data) and Abstracts Views on Vision4Press platform.
Data correspond to usage on the plateform after 2015. The current usage metrics is available 48-96 hours after online publication and is updated daily on week days.
Initial download of the metrics may take a while.