Fig. 9.
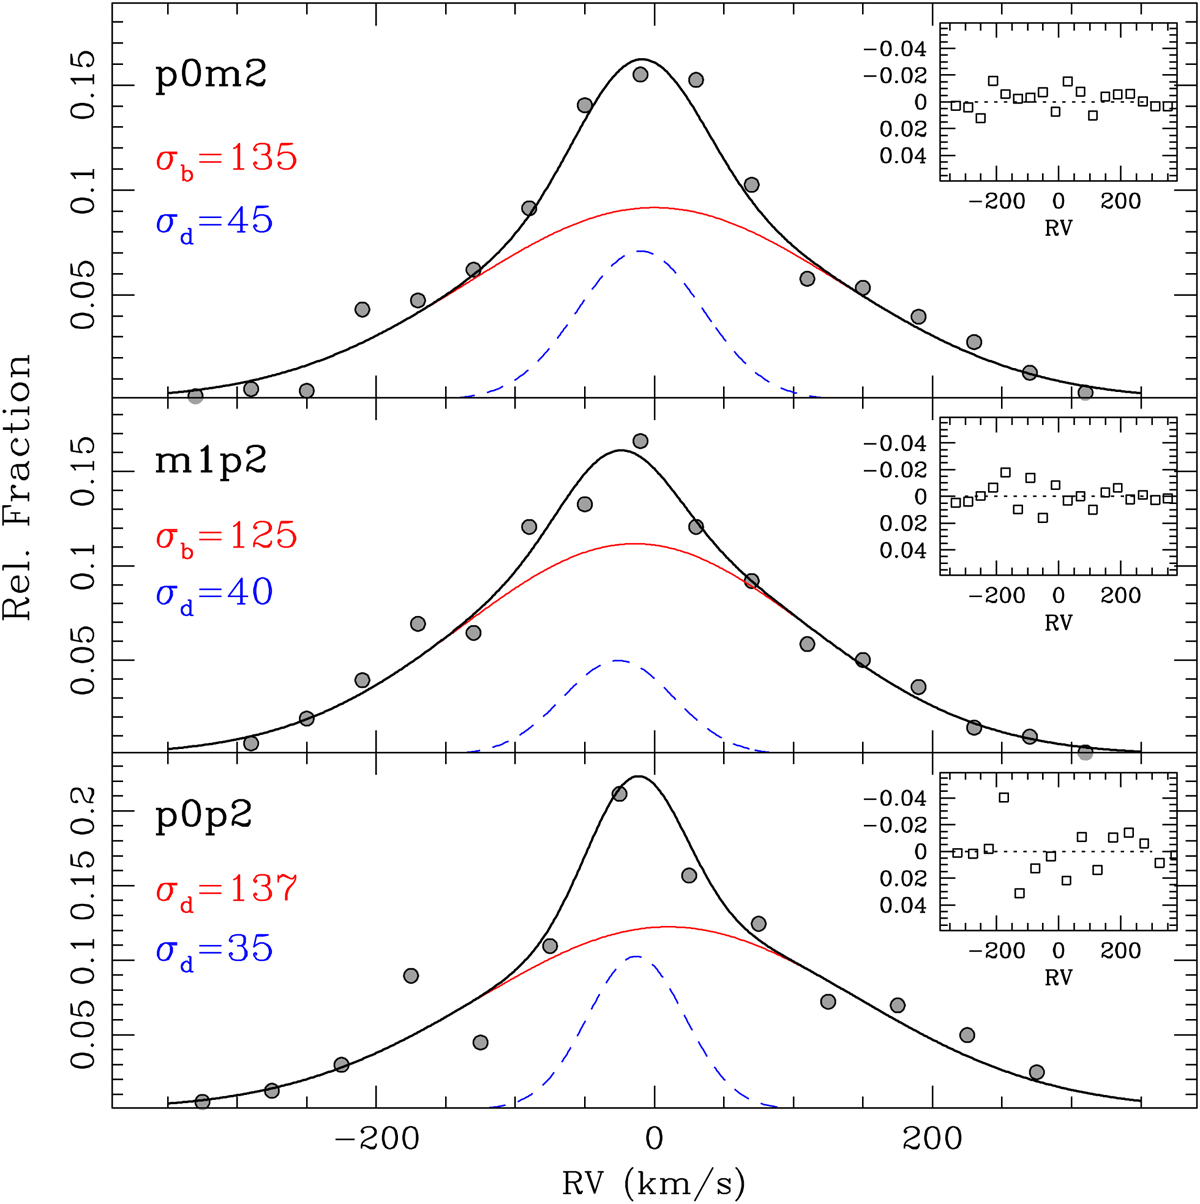
Normalized heliocentric radial velocity distribution function for all sampled stars observed in the p0m2 (top panel), m1p2 (middle panel), and p0p2 (bottom panel) fields. The best fit to the velocity distribution (solid black line) is obtained by using a combination of two Gaussian (red and blue solid lines) functions whose sigma are also reported in each panel. The residuals of the best fit are shown for each field in the insets.
Current usage metrics show cumulative count of Article Views (full-text article views including HTML views, PDF and ePub downloads, according to the available data) and Abstracts Views on Vision4Press platform.
Data correspond to usage on the plateform after 2015. The current usage metrics is available 48-96 hours after online publication and is updated daily on week days.
Initial download of the metrics may take a while.