Fig. 9
![]() zeropoint temporalevolution (for the CCD in row 6, strip15 and Fov1). The red arrows indicatethe decontamination events that resulted in an improvement of the
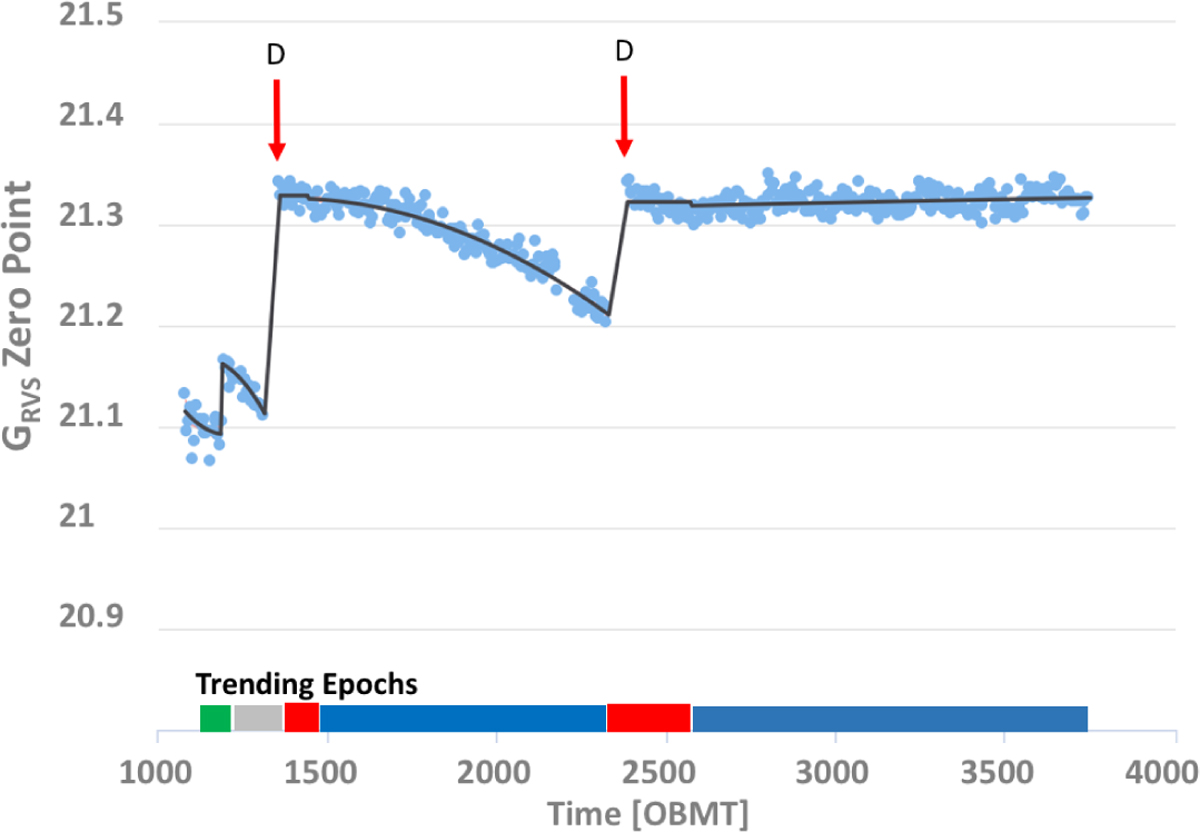
zeropoint temporalevolution (for the CCD in row 6, strip15 and Fov1). The red arrows indicatethe decontamination events that resulted in an improvement of the
![]() zeropoint. After the decontamination at OBMT 2330.6, there is no degradation of the RVS transmission, and the decontamination events become rarer over mission time. The trending epochs are indicated in the same way as in Fig. 4. During the first trending epoch, a wrong catalogue was used, and the zeropoint data obtained in this epoch should be offset by ~ + 0.08 magnitudes.
zeropoint. After the decontamination at OBMT 2330.6, there is no degradation of the RVS transmission, and the decontamination events become rarer over mission time. The trending epochs are indicated in the same way as in Fig. 4. During the first trending epoch, a wrong catalogue was used, and the zeropoint data obtained in this epoch should be offset by ~ + 0.08 magnitudes.
Current usage metrics show cumulative count of Article Views (full-text article views including HTML views, PDF and ePub downloads, according to the available data) and Abstracts Views on Vision4Press platform.
Data correspond to usage on the plateform after 2015. The current usage metrics is available 48-96 hours after online publication and is updated daily on week days.
Initial download of the metrics may take a while.