Fig. 6
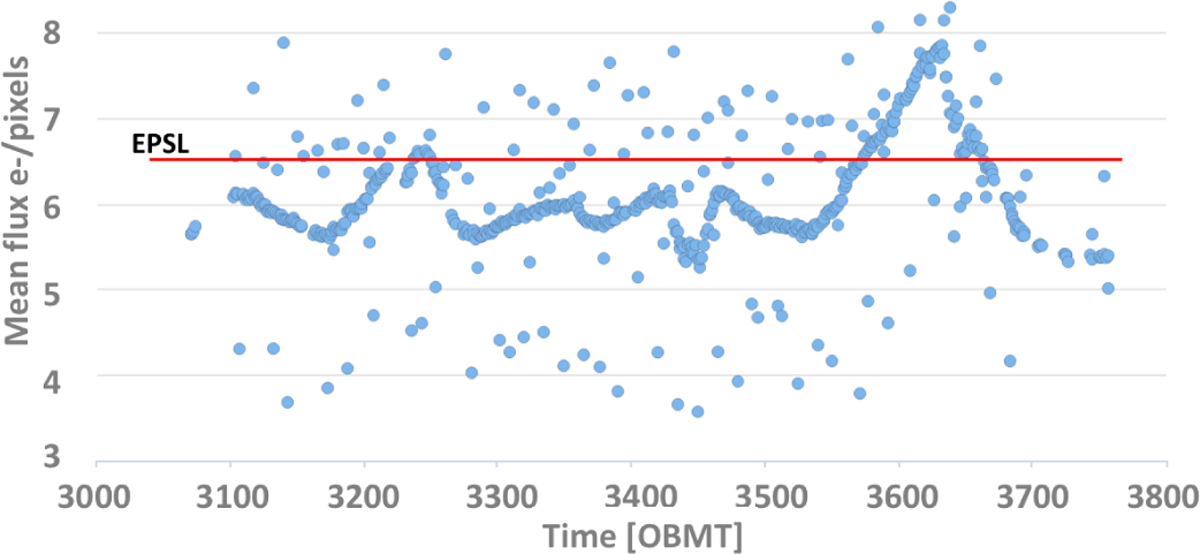
Temporal evolution of the mean level of the scatter map in CCD row 6 strip 16 during the last period covered by the DR2data set. The timescale is expressed in OBMT, and the time interval shown corresponds to 12 December 2015 and 23 May 2016. Each blue point represents the mean background level over 30 h. It is computed using the scatter map obtained with the VOs acquired in 30 h (outliers are from VO incompleteness). The units are e− /pix, not divided by the 4.4 seconds exposure time. The red horizontal line at 6.54 e− pix−1 is the mean level of the scatter map obtained with the EPSL VO data and is used to process the whole DR2 data. The peak at OBMT 3600 corresponds to a scanning of the Galactic plane by Gaia and arises from the contribution to the straylight from the high density of external (i.e. non-solar) sources in these scans.
Current usage metrics show cumulative count of Article Views (full-text article views including HTML views, PDF and ePub downloads, according to the available data) and Abstracts Views on Vision4Press platform.
Data correspond to usage on the plateform after 2015. The current usage metrics is available 48-96 hours after online publication and is updated daily on week days.
Initial download of the metrics may take a while.