Fig. 4
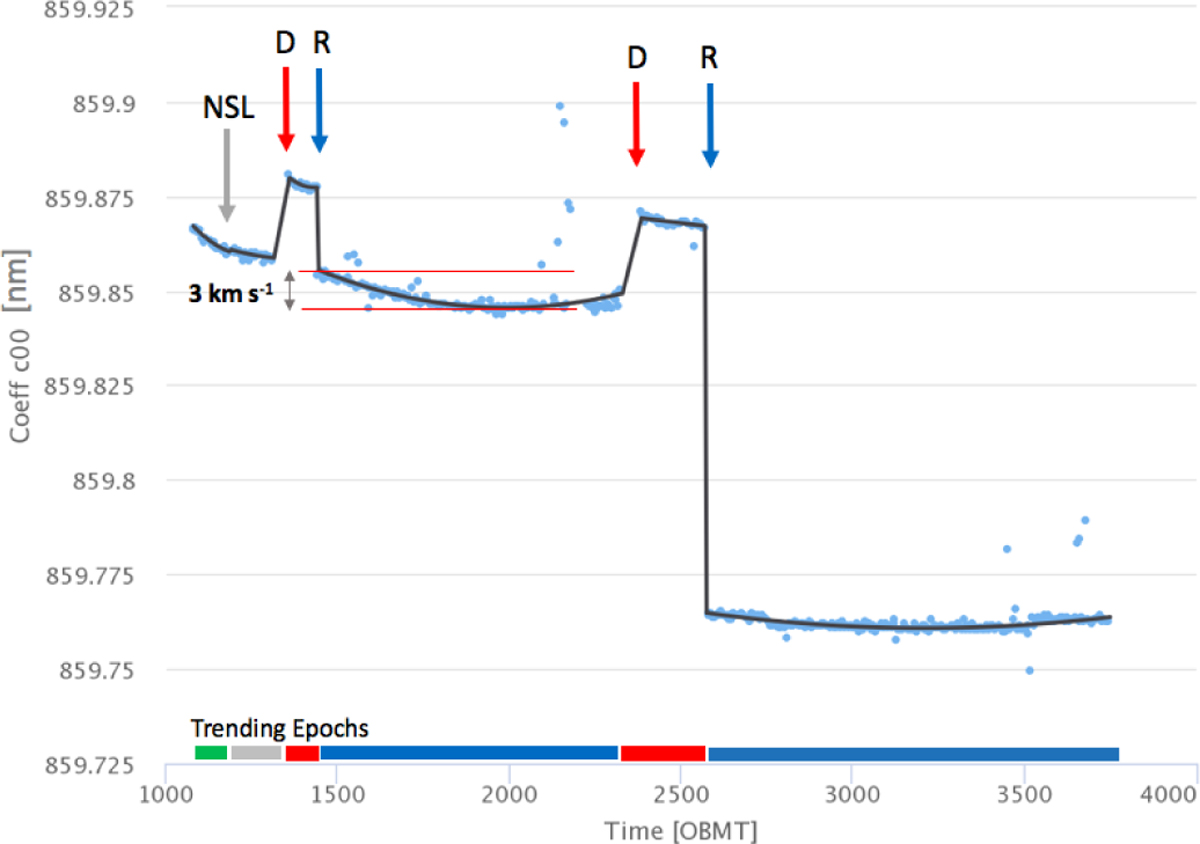
Wavelength calibration model: Trending function of the coefficient C00, representingthe wavelength-calibration zeropoint, shown for the CCD in row 5, strip 16, and FoV1 (black line). The timescale onthe abscissa is expressed in OBMT (revolutions, Sect. 3). The blue points are the values of C00 obtained at each calibration unit. The arrows indicate breakpoints. The most important discontinuities are due to optics decontamination (red arrows, at OBMT 1317 and 2330.6) and to the re-focusing events (blue arrows, at 1443.9 and 2574.6). An additional breakpoint was set at the transition between EPSL and NSL, at OBMT 1192.13 (grey arrow). The DR2 data set that covers the time between OBMT 1078 (25 July 2014) and 3750.5 (23 May 2016) was divided into six trending epochs that are indicated with colour bars along the abscissa: shortly after each decontamination, a re-focusing was needed, and the trending epochs between these two events (the red bars) are short. The two red horizontal lines delimit the variation of the wavelength zeropoint over one trending epoch. These variations are typically small, < 3 km s−1 (~0.3 pixels).
Current usage metrics show cumulative count of Article Views (full-text article views including HTML views, PDF and ePub downloads, according to the available data) and Abstracts Views on Vision4Press platform.
Data correspond to usage on the plateform after 2015. The current usage metrics is available 48-96 hours after online publication and is updated daily on week days.
Initial download of the metrics may take a while.