Open Access
Fig. 2
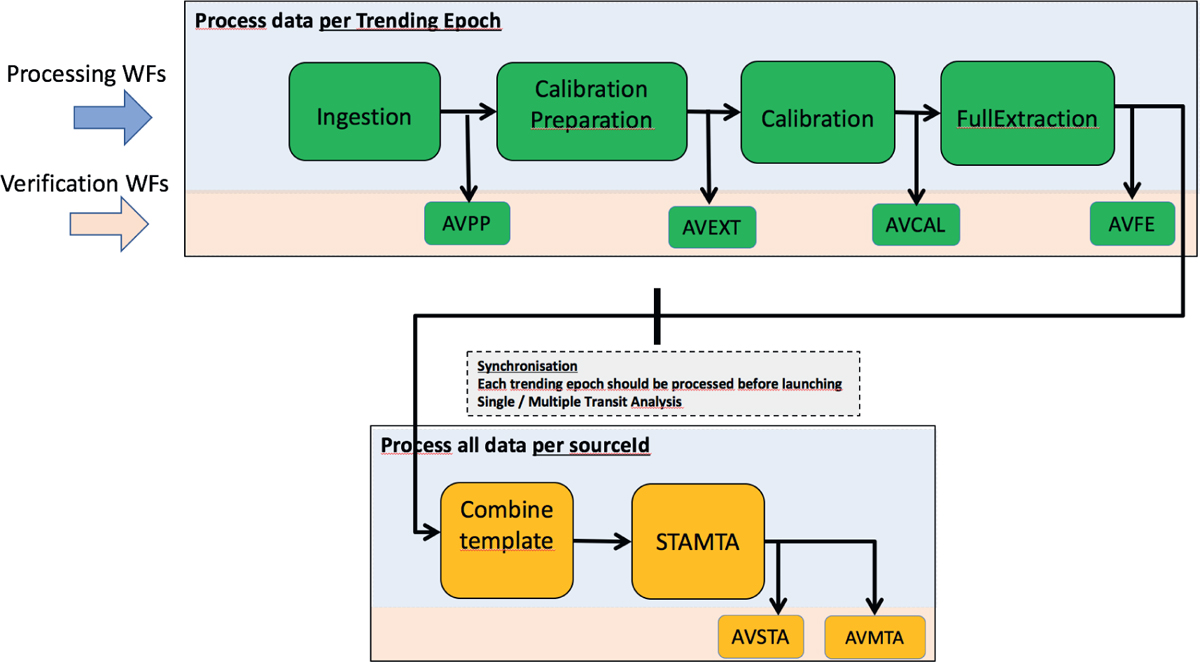
Flow chart of the spectroscopic pipeline. The pipeline is composed of six processing workflows and six verification workflows. The green workflows process the data per transit (i.e. per observation). The yellow workflows process the data per source and collect the information produced upstream from each transit.
Current usage metrics show cumulative count of Article Views (full-text article views including HTML views, PDF and ePub downloads, according to the available data) and Abstracts Views on Vision4Press platform.
Data correspond to usage on the plateform after 2015. The current usage metrics is available 48-96 hours after online publication and is updated daily on week days.
Initial download of the metrics may take a while.