Open Access
Fig. 15
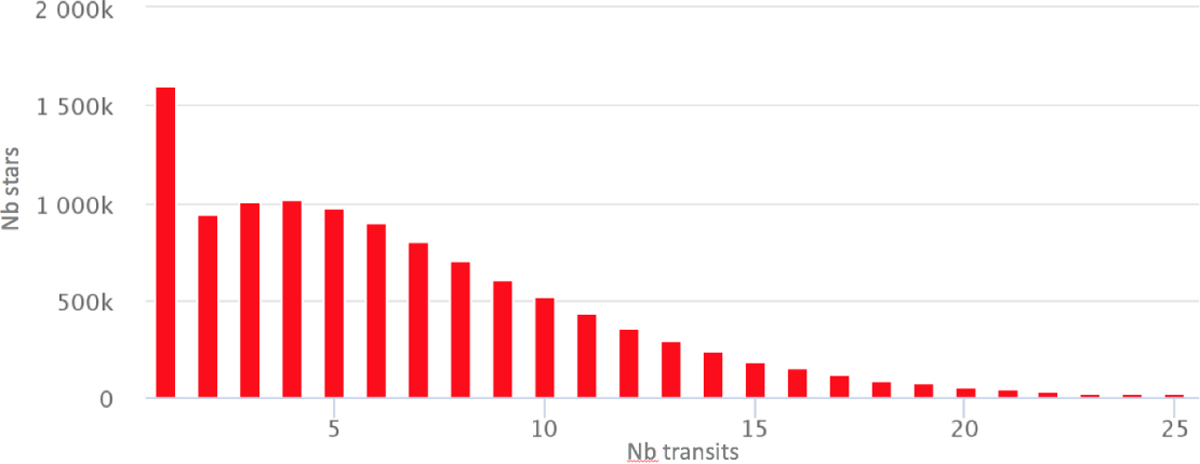
Distribution of the number of stars as a function of their number of transits. The x-axis shows the number of transits, and the y-axis shows the number of stars. 1.6 million sources had only one valid transit, and for these sources, V R is not computed.
Current usage metrics show cumulative count of Article Views (full-text article views including HTML views, PDF and ePub downloads, according to the available data) and Abstracts Views on Vision4Press platform.
Data correspond to usage on the plateform after 2015. The current usage metrics is available 48-96 hours after online publication and is updated daily on week days.
Initial download of the metrics may take a while.