Fig. 12
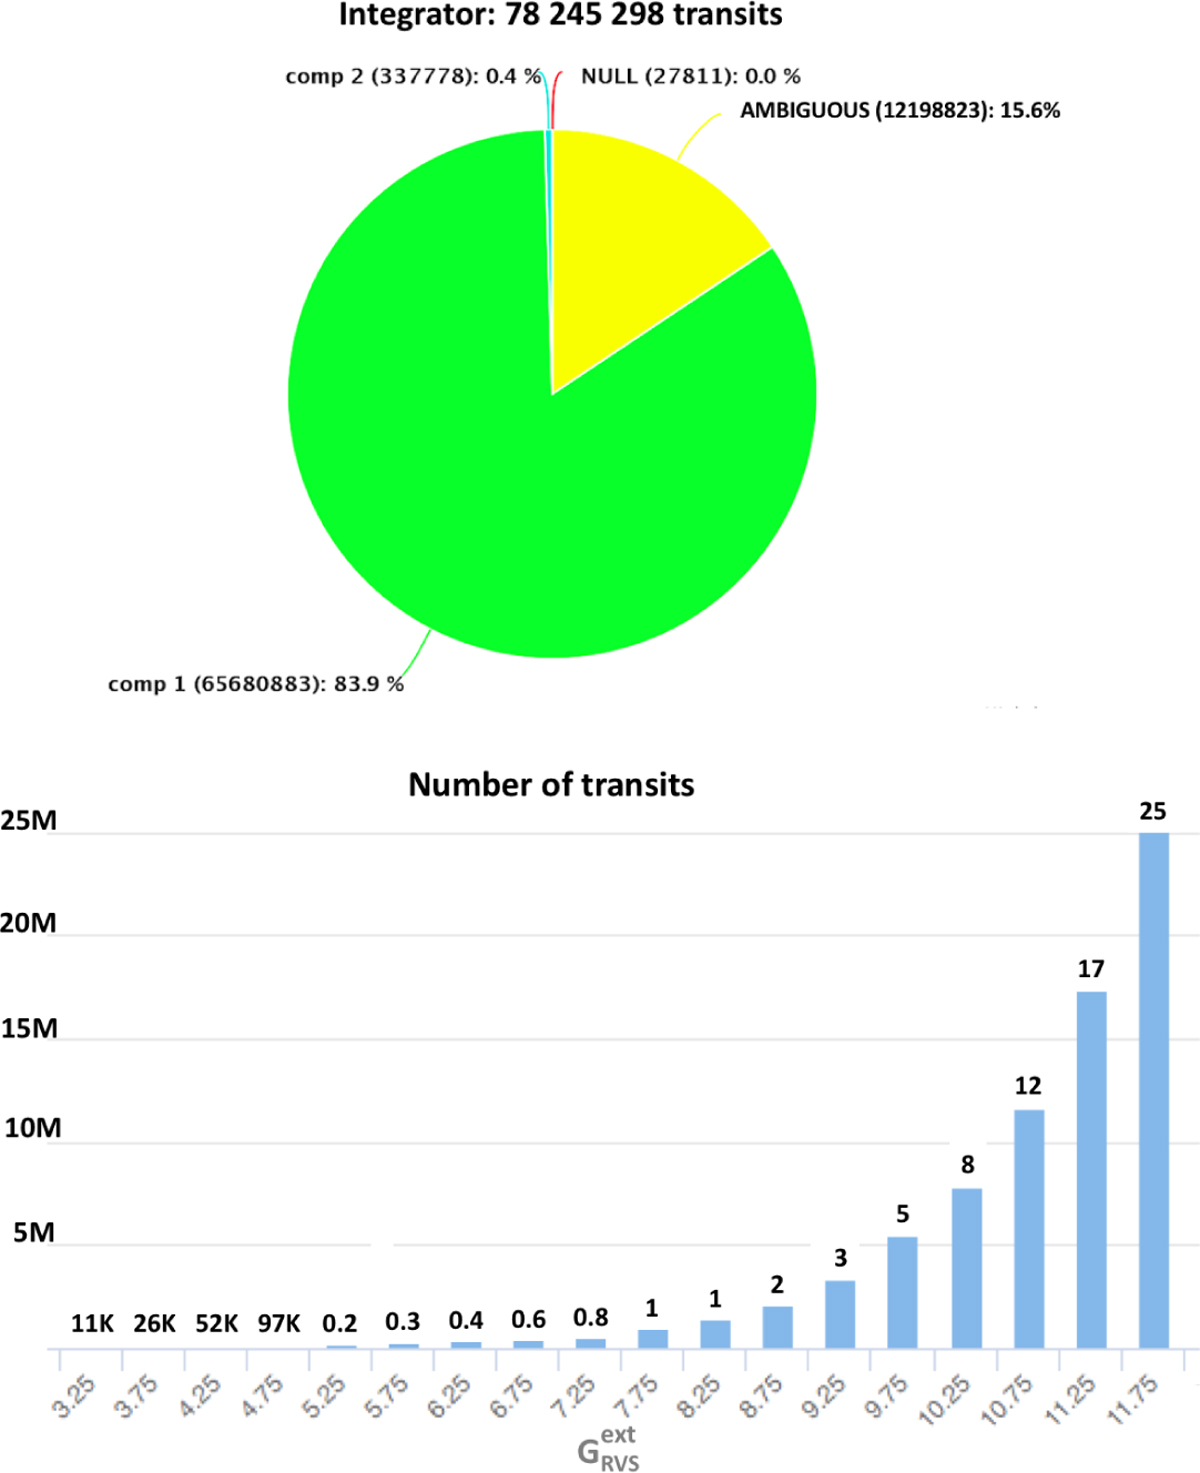
STA statistics. The total number of transits for which a ![]() is obtained is ~78 million (with ~28 000 null, because invalid in the three STA methods RvFou, RvDir, and RVMDM). Top: Pie chart showing that 16% of the
is obtained is ~78 million (with ~28 000 null, because invalid in the three STA methods RvFou, RvDir, and RVMDM). Top: Pie chart showing that 16% of the
![]() obtained have been flagged as ambiguous, 84% of the transits have been detected as single components (comp 1), and in 0.4% of the transits, multiple-lines have been detected and the transit was flagged as two components (comp 2). Bottom:Histogram of the distribution of the number of transits as a function of
obtained have been flagged as ambiguous, 84% of the transits have been detected as single components (comp 1), and in 0.4% of the transits, multiple-lines have been detected and the transit was flagged as two components (comp 2). Bottom:Histogram of the distribution of the number of transits as a function of ![]() .
.
Current usage metrics show cumulative count of Article Views (full-text article views including HTML views, PDF and ePub downloads, according to the available data) and Abstracts Views on Vision4Press platform.
Data correspond to usage on the plateform after 2015. The current usage metrics is available 48-96 hours after online publication and is updated daily on week days.
Initial download of the metrics may take a while.