Fig. 9.
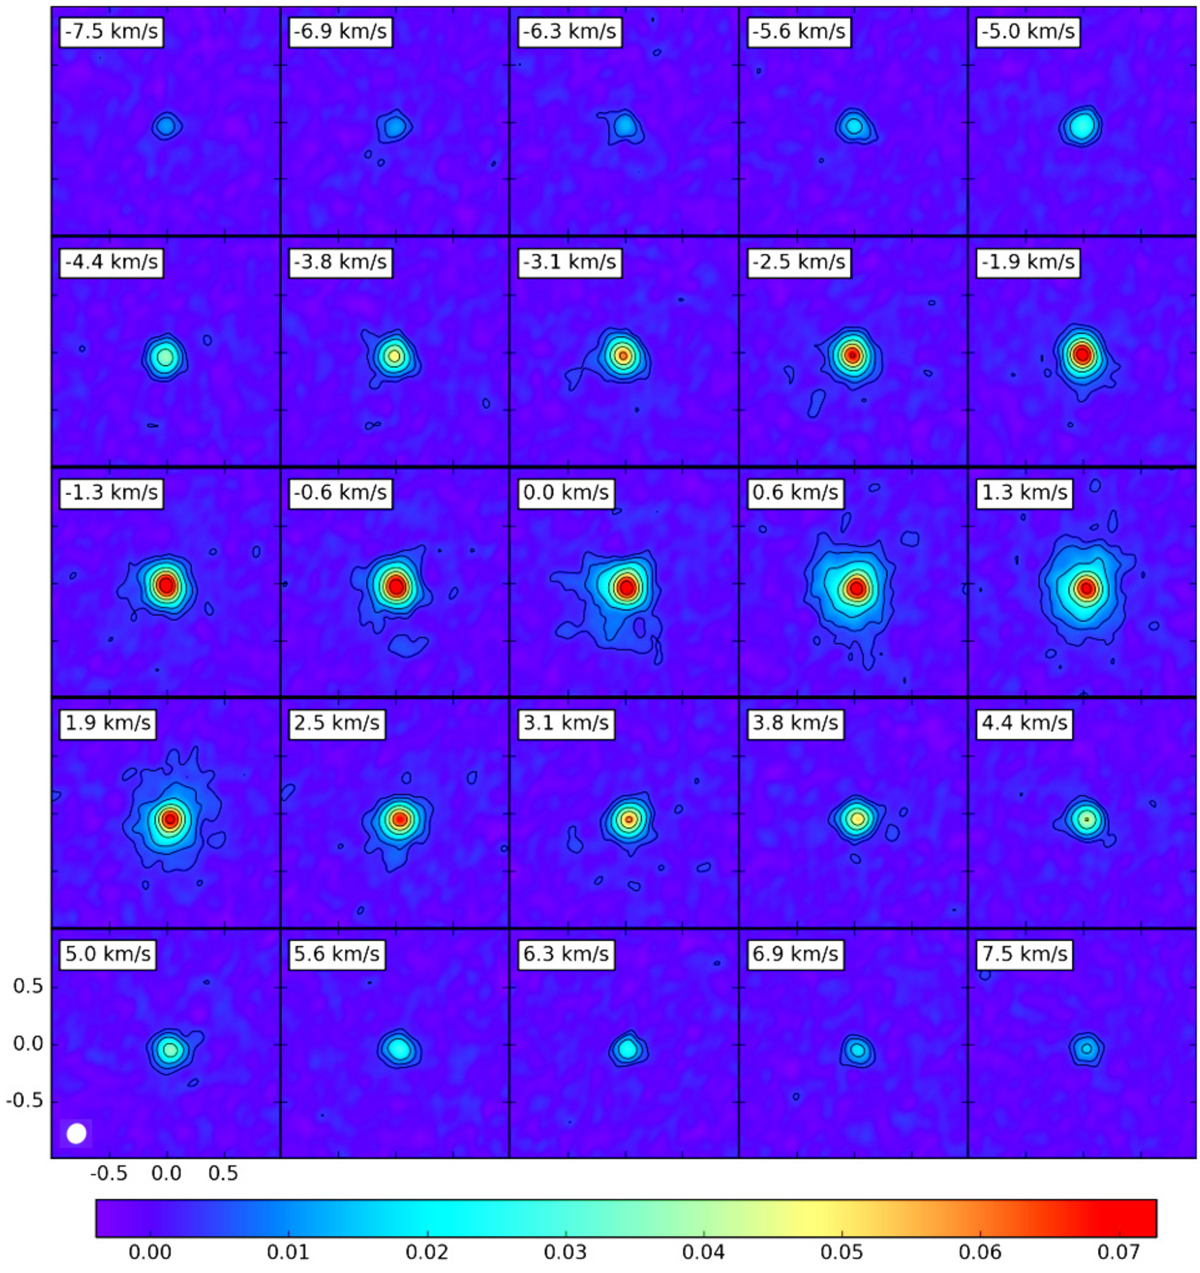
Continuum-subtracted channel maps of the SO2 emission. The contours are drawn at 3, 6, 12, 24, 36, 48, and 60 times the rms noise value outside the line (1.18 × 10⁻³ Jy beam−1). Length scales and FWHM of the resolving beam are indicated in the bottom left panel. Flux units are in Jy beam−1. The continuum peak is located in the centre of the brightest contour. Velocity labels are relative to the υ*. The emission is confined to the centremost regions of the wind, and is mostly spherical in nature.
Current usage metrics show cumulative count of Article Views (full-text article views including HTML views, PDF and ePub downloads, according to the available data) and Abstracts Views on Vision4Press platform.
Data correspond to usage on the plateform after 2015. The current usage metrics is available 48-96 hours after online publication and is updated daily on week days.
Initial download of the metrics may take a while.