Fig. 7.
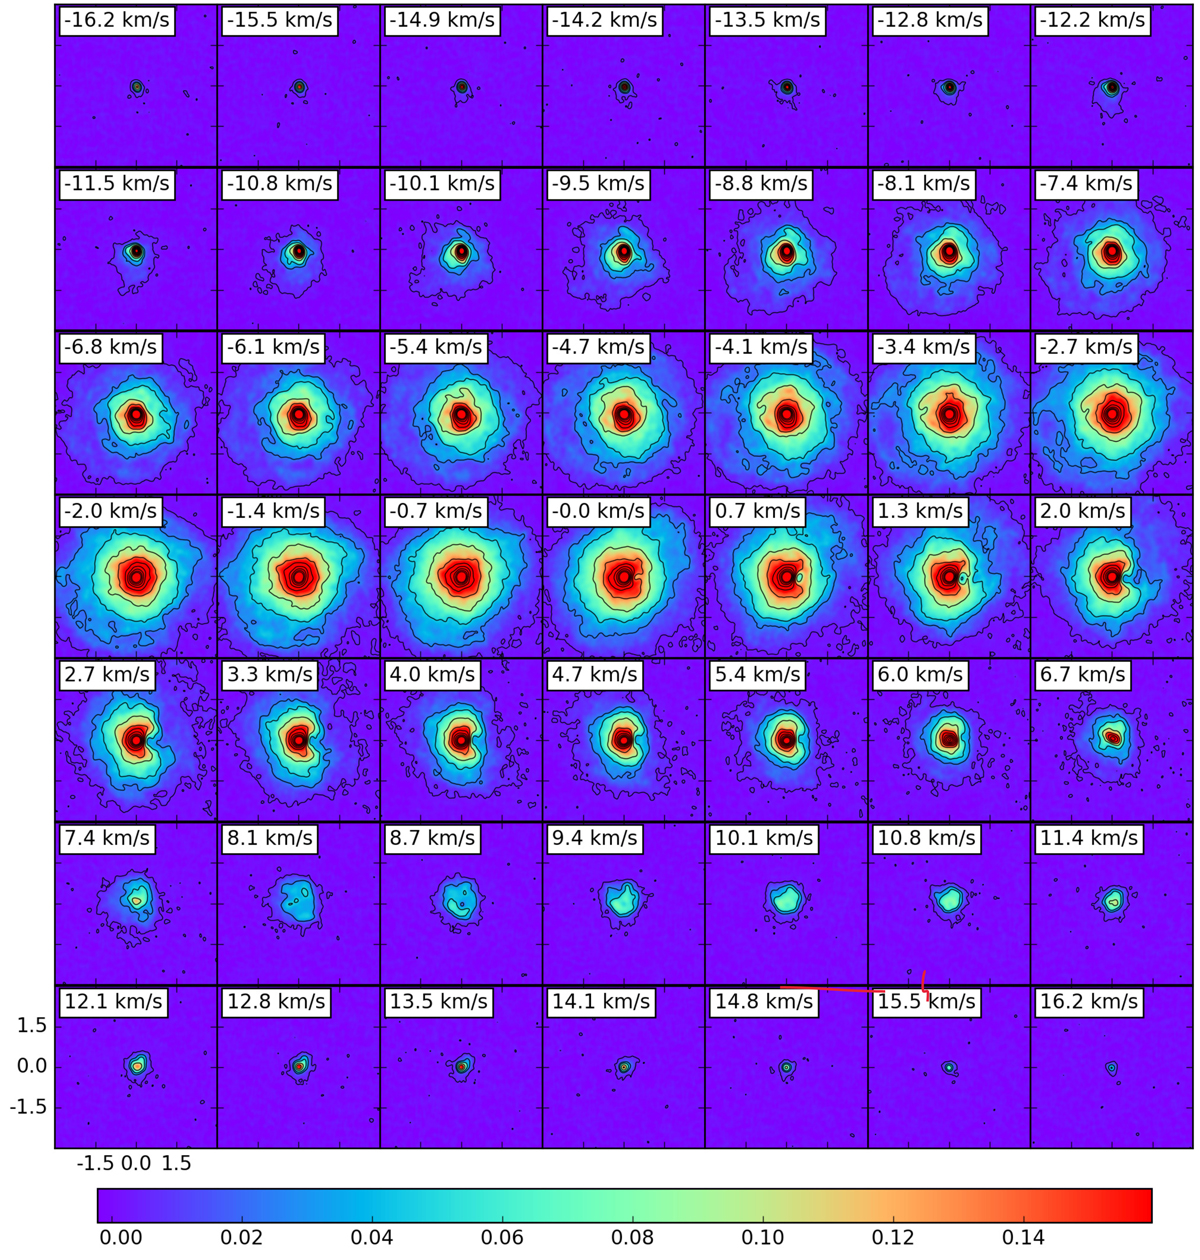
Continuum-subtracted channel maps of the SiO emission. The contours are drawn at 3, 20, 36, and then every multiple of 36 up to 291 times the rms noise value outside the line (1.2 × 10⁻³ Jy beam−1). Length scales are indicated in the bottom left panel. Flux units are in Jy beam−1. The continuum peak is located in the centre of the brightest contour. The beam size is not illustrated on the plots because it is too small (0.205″ × 0.187″). The emission is mostly spherical in nature, except for a distinct hole present to the west of the peak flux position, in the channels between ~6 and ~0 km s−1.
Current usage metrics show cumulative count of Article Views (full-text article views including HTML views, PDF and ePub downloads, according to the available data) and Abstracts Views on Vision4Press platform.
Data correspond to usage on the plateform after 2015. The current usage metrics is available 48-96 hours after online publication and is updated daily on week days.
Initial download of the metrics may take a while.