Fig. 5.
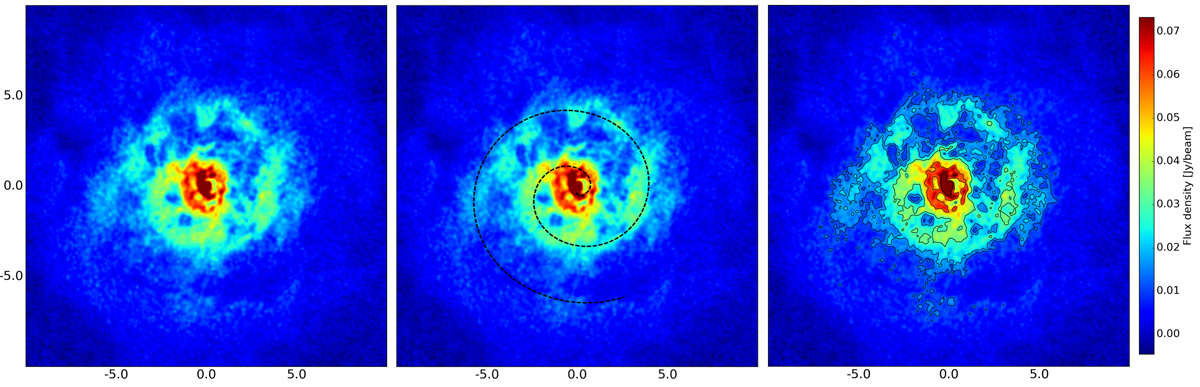
Left panel: central channel (at υ = 0 km s−1) of the CO emission. The spiral shape is clearly visible. Middle panel: a black dashed Archimedean spiral is plotted over the channel’s emission distribution, to guide the eye. Right panel: contour map of the central channel. Contours are drawn at 10, 15, 25, 45, and 65 times the rms noise value outside the line (1.25 × 10⁻³ Jy beam−1). The spiral exhibits a high degree of substructure, with voids and clumps. The central region of the spiral is bright and shows complexity beyond the expected spiral pattern.
Current usage metrics show cumulative count of Article Views (full-text article views including HTML views, PDF and ePub downloads, according to the available data) and Abstracts Views on Vision4Press platform.
Data correspond to usage on the plateform after 2015. The current usage metrics is available 48-96 hours after online publication and is updated daily on week days.
Initial download of the metrics may take a while.