Fig. 4.
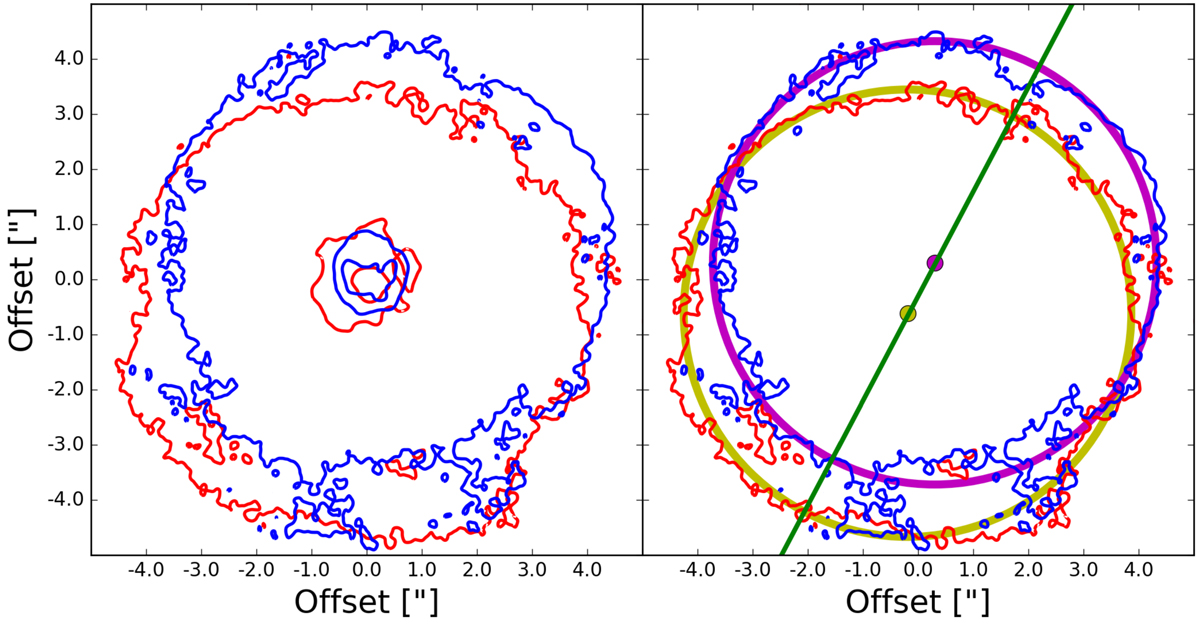
Left panel: stereogram of the CO cube. The blue (red) contours correspond to the velocity-averaged emission profile of the blue-shifted (red-shifted) portion of line outside of the central peak. The contours are drawn at 3, 13, and 23 times the rms noise value outside the line (1.25 × 10⁻³ Jy beam−1). Right panel: the purple and yellow circles show the circular nature of the 3σrms emission. The purple and yellow dots represent the centres of the respective circles. The green line (150° from north, anticlockwise) is the axis along which these circle centres are separated, and therefore the axis along which the system is inclined.
Current usage metrics show cumulative count of Article Views (full-text article views including HTML views, PDF and ePub downloads, according to the available data) and Abstracts Views on Vision4Press platform.
Data correspond to usage on the plateform after 2015. The current usage metrics is available 48-96 hours after online publication and is updated daily on week days.
Initial download of the metrics may take a while.