Fig. 3.
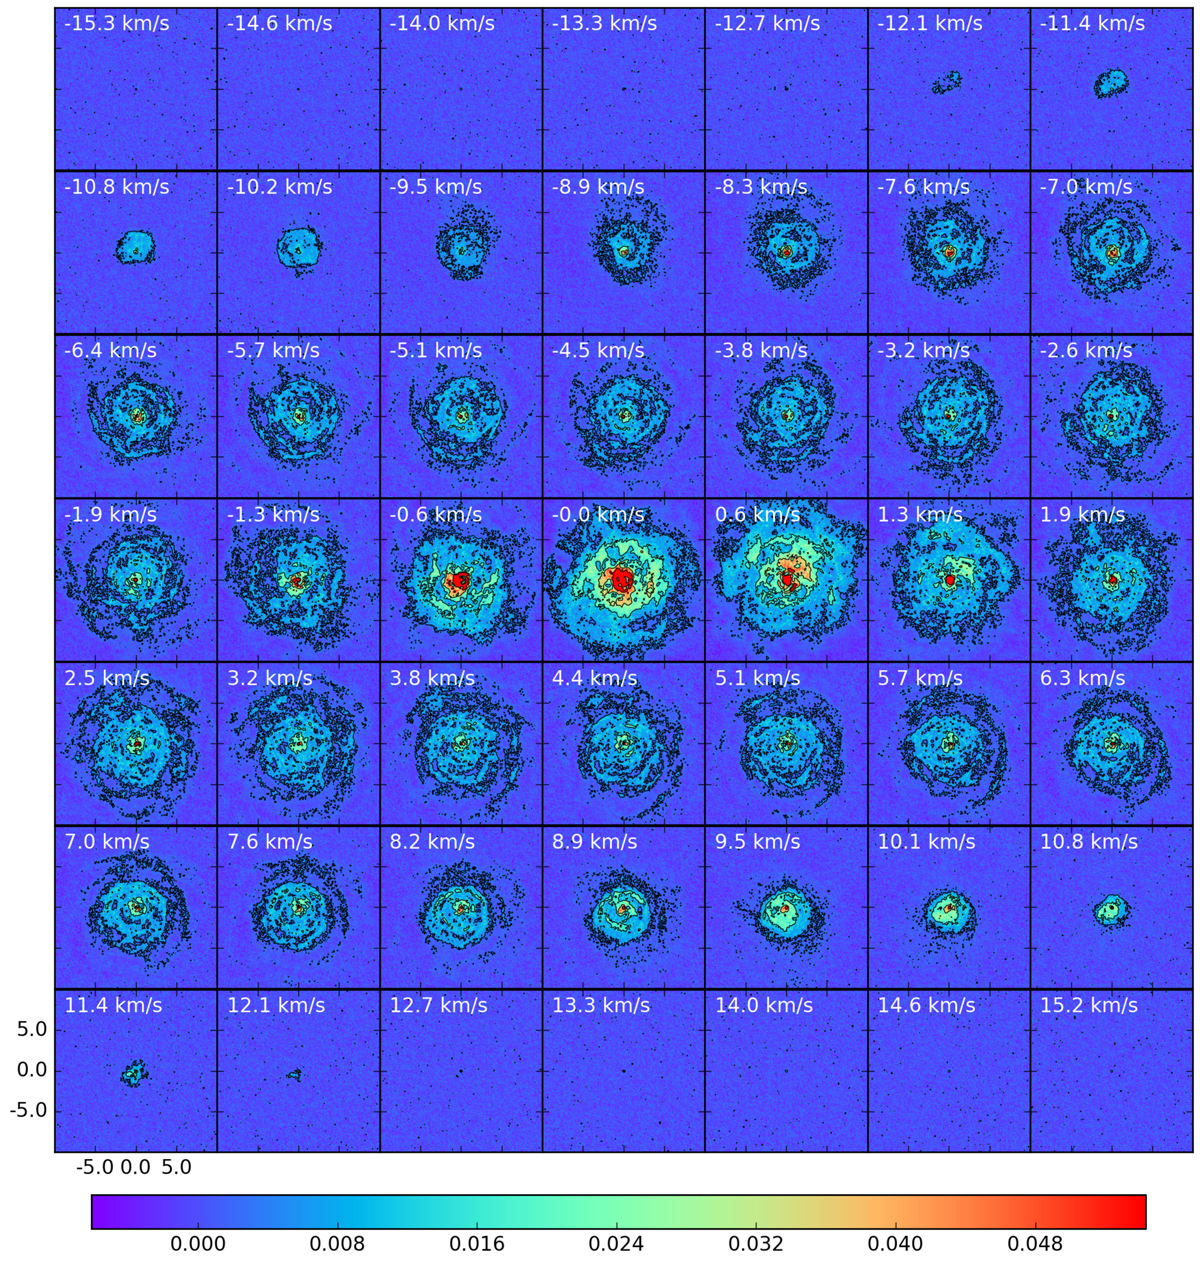
Continuum-subtracted channel maps of the CO emission corrected for υ*. The central observed frequency is the average over the observation epochs. The contours are drawn at 3, 12, 25, and 40 times the rms noise value outside the line (1.25 × 10⁻³ Jy beam−1). Length scales are indicated in the bottom left panel. Flux units are in Jy beam−1. The continuum peak is located in the centre of the brightest contour. The beam size is not illustrated on the plots because it is too small (0.184″ × 0.171″). The emission exhibits a high degree of structure. Faint filaments are visible at large distances from the continuum peak position. At υ = 0 km s−1 a spiral shape can be seen, with a bright centre.
Current usage metrics show cumulative count of Article Views (full-text article views including HTML views, PDF and ePub downloads, according to the available data) and Abstracts Views on Vision4Press platform.
Data correspond to usage on the plateform after 2015. The current usage metrics is available 48-96 hours after online publication and is updated daily on week days.
Initial download of the metrics may take a while.