Fig. 2.
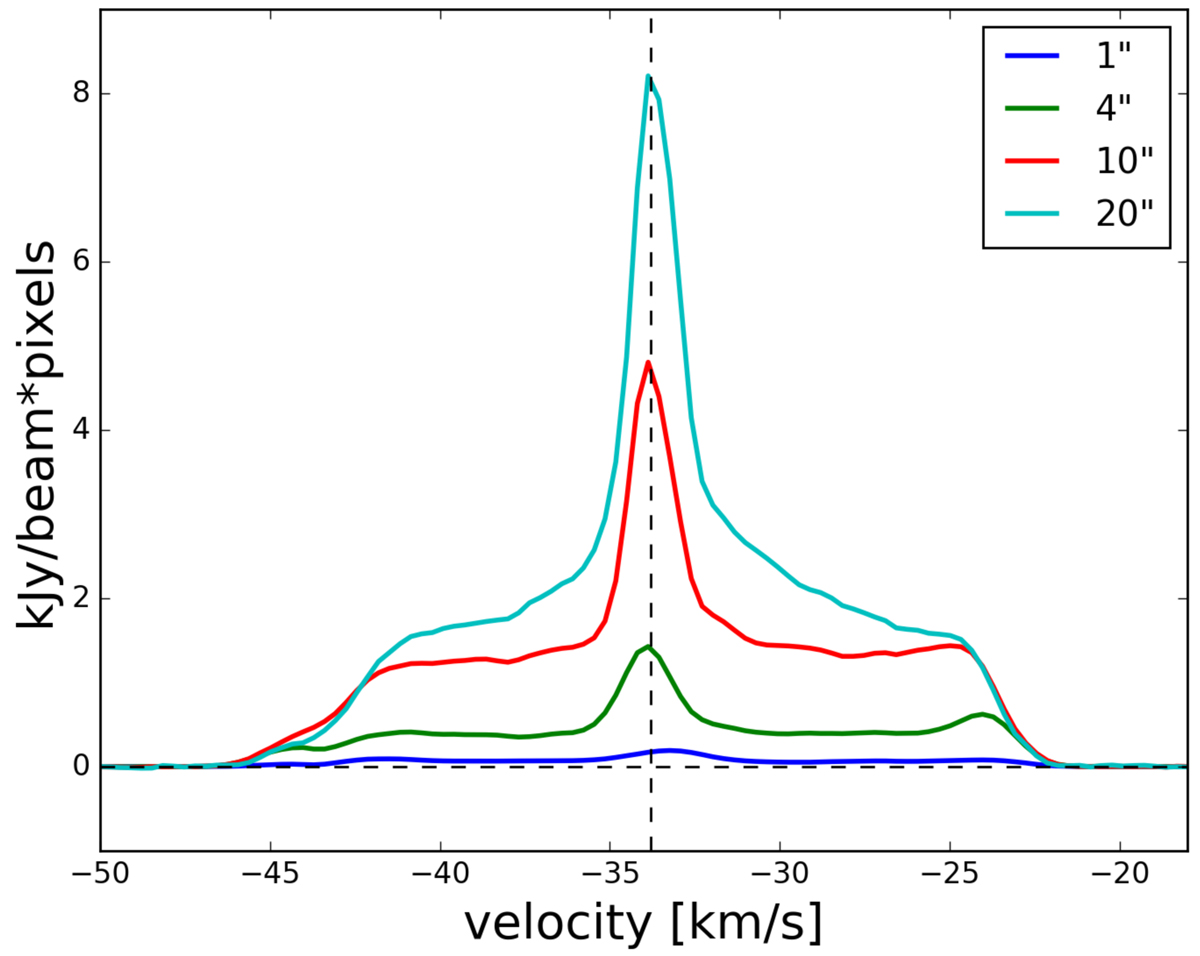
Spectral line of the CO emission for different circular apertures (diameters in legend). The shape is explicitly dual in nature with a broad plateau superposed by a bright narrow central peak. Black dashed lines have been added to the plot to indicate the zero flux level and the υ*.
Current usage metrics show cumulative count of Article Views (full-text article views including HTML views, PDF and ePub downloads, according to the available data) and Abstracts Views on Vision4Press platform.
Data correspond to usage on the plateform after 2015. The current usage metrics is available 48-96 hours after online publication and is updated daily on week days.
Initial download of the metrics may take a while.