Fig. B.2.
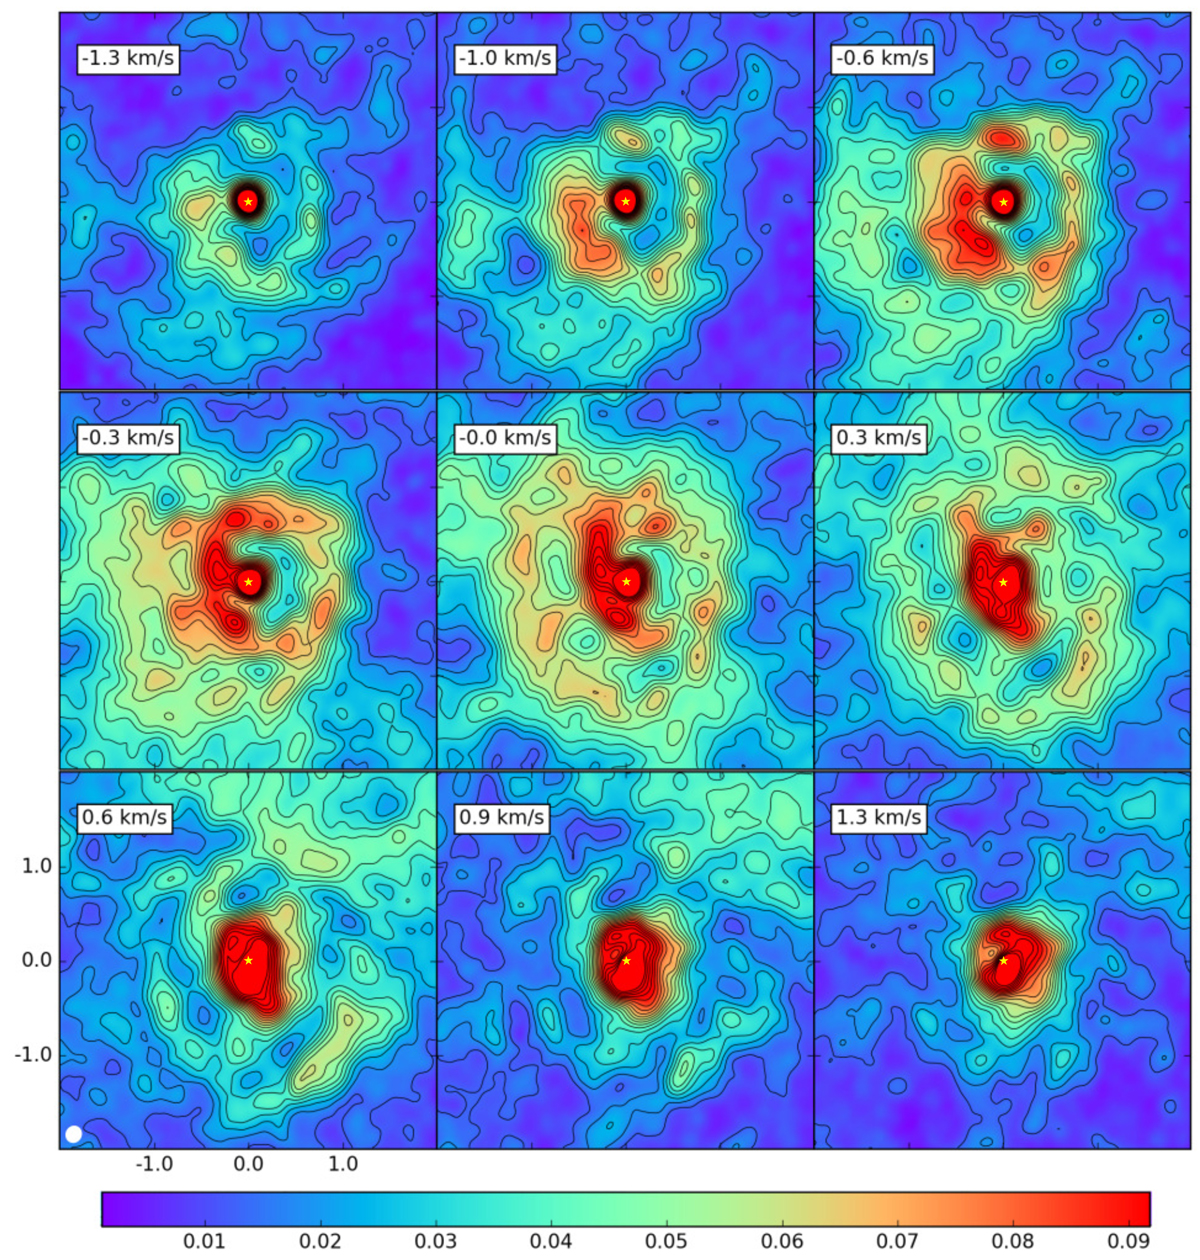
Channel maps of the central peak of the CO spectral line, zooming in on the bright central region. The contours are drawn at 10, 15, 20, … 85, and 90 times the rms noise value outside the line (1.25 × 10⁻³ Jy beam−1). The continuum brightness peak is indicated with the yellow star. The density of contours exhibits the high degree of structure in the spiral formation zone.
Current usage metrics show cumulative count of Article Views (full-text article views including HTML views, PDF and ePub downloads, according to the available data) and Abstracts Views on Vision4Press platform.
Data correspond to usage on the plateform after 2015. The current usage metrics is available 48-96 hours after online publication and is updated daily on week days.
Initial download of the metrics may take a while.