Fig. B.1.
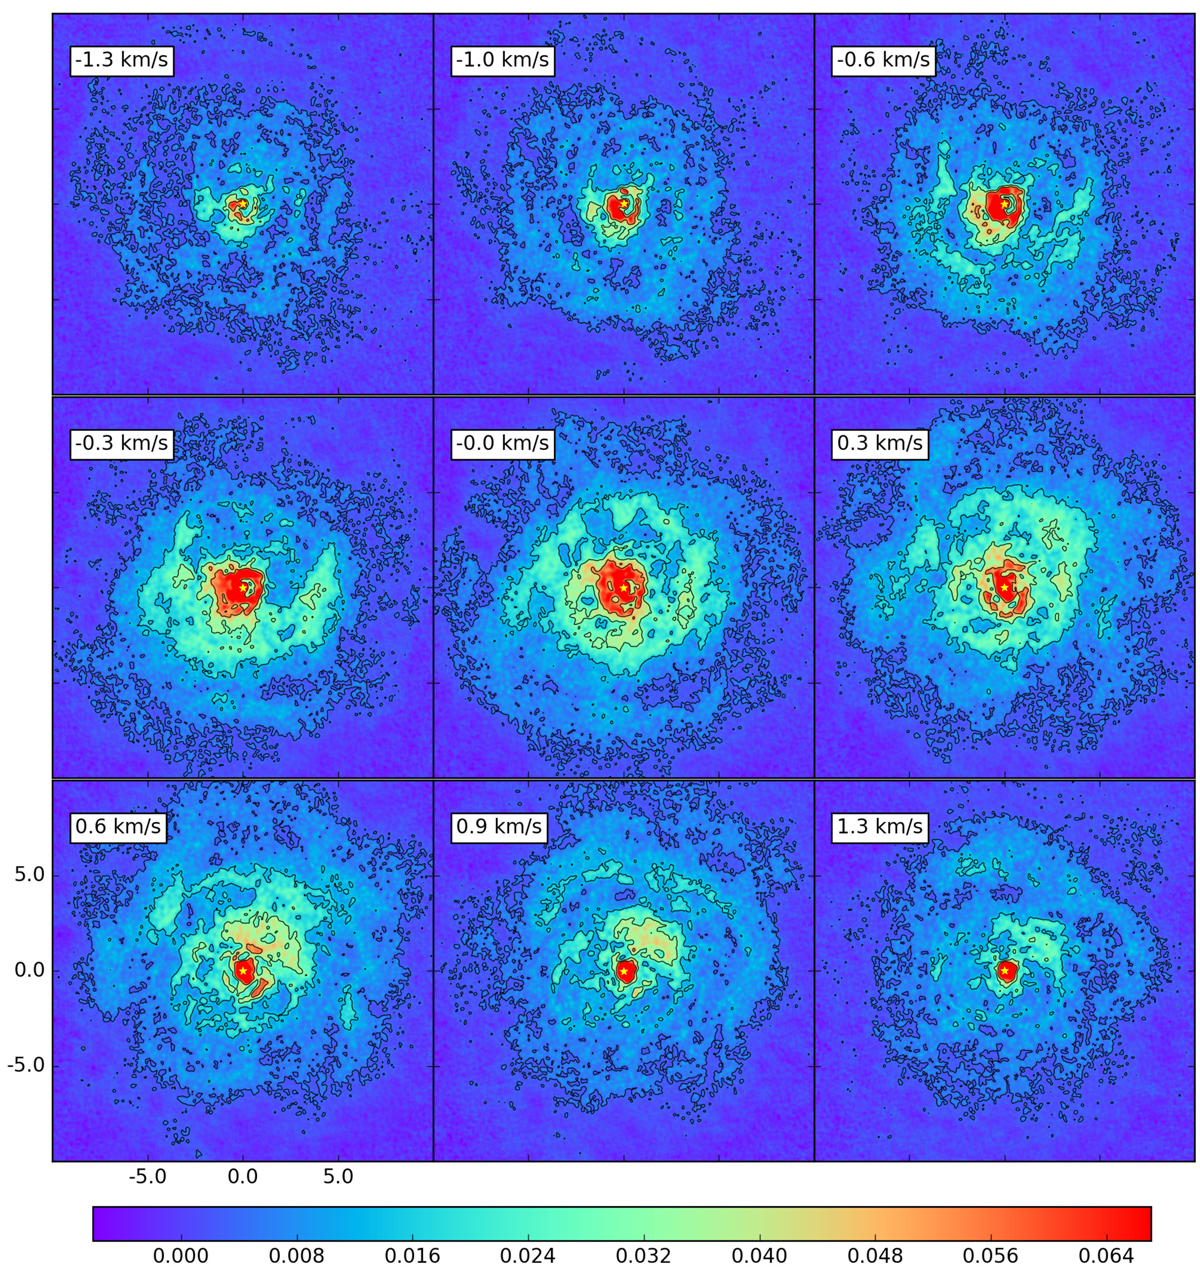
Channel maps of the central peak of the CO spectral line. The contours are drawn at 3, 12, 25, and 40 times the rms nois e value outside the line (1.25 × 10⁻³ Jy beam−1). The continuum brightness peak is indicated with the yellow star. The spiral feature can be seen to appear in the north-west and recede in the south-east, from blue- to red-shifted emission, respectively.
Current usage metrics show cumulative count of Article Views (full-text article views including HTML views, PDF and ePub downloads, according to the available data) and Abstracts Views on Vision4Press platform.
Data correspond to usage on the plateform after 2015. The current usage metrics is available 48-96 hours after online publication and is updated daily on week days.
Initial download of the metrics may take a while.