Fig. 14.
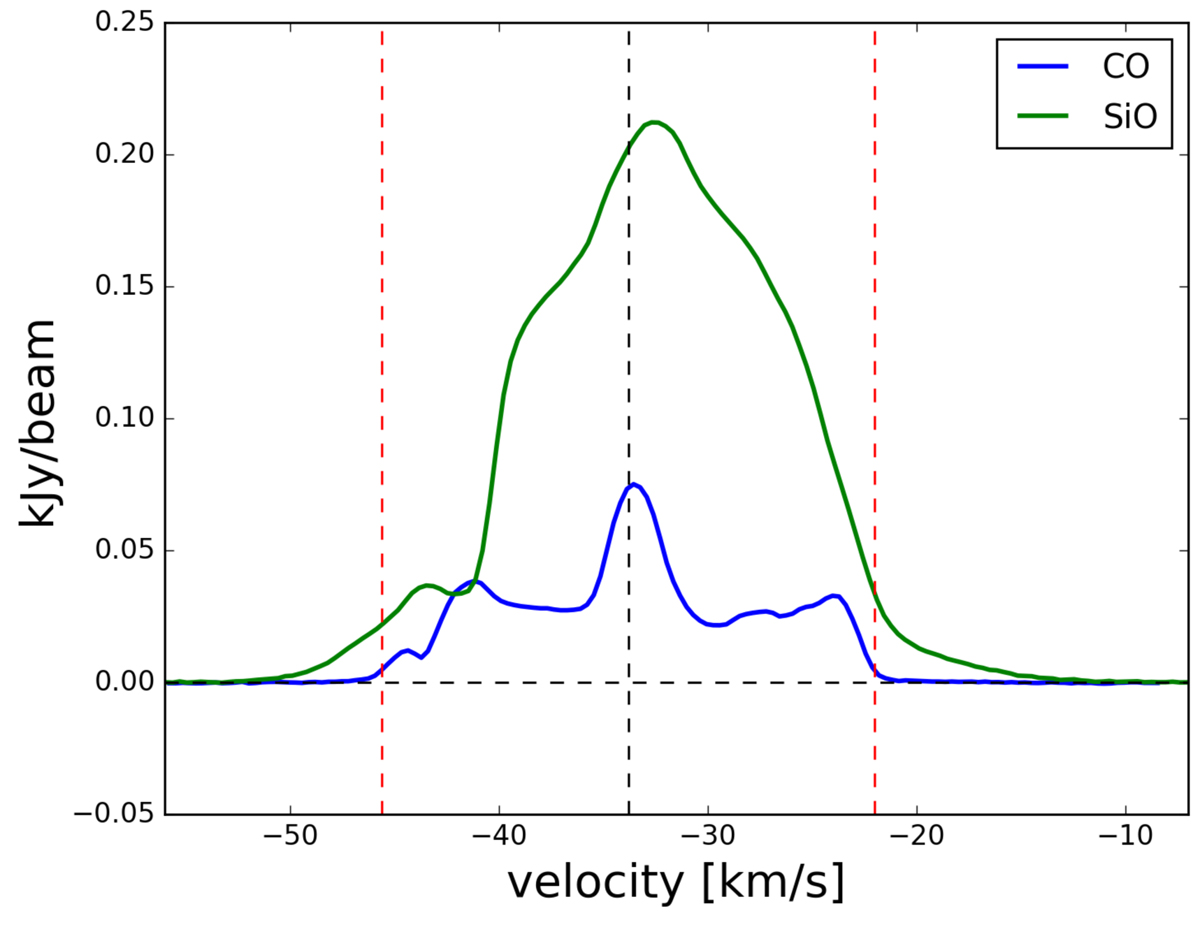
Comparison between the mean flux of the CO and SiO emission in a circular aperture of 1″, centre on the continuum peak. Black dashed lines have been added to the plot to indicate the zero flux level and the υ*. The SiO is intrinsically much brighter, and as a consequence it exhibits much broader high-velocity wings than CO. This is illustrated by the red dashed lines, which mark the velocities at which the CO line subsides below the noise.
Current usage metrics show cumulative count of Article Views (full-text article views including HTML views, PDF and ePub downloads, according to the available data) and Abstracts Views on Vision4Press platform.
Data correspond to usage on the plateform after 2015. The current usage metrics is available 48-96 hours after online publication and is updated daily on week days.
Initial download of the metrics may take a while.