Fig. 13.
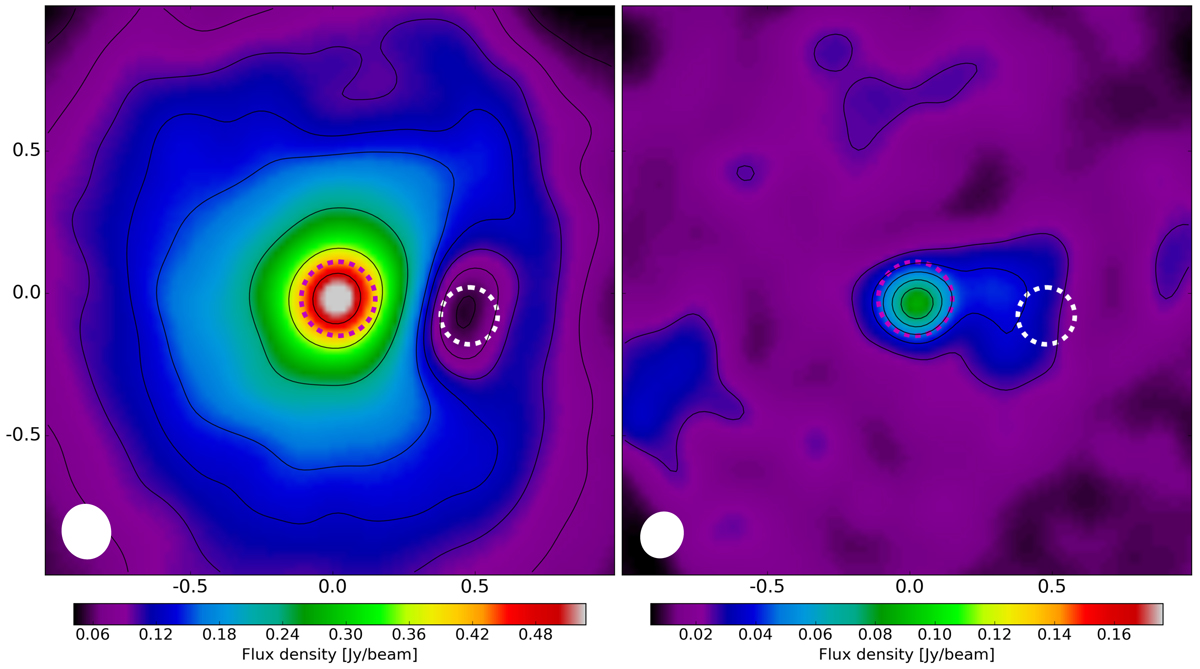
Left panel: SiO emission distribution in the 1.4 km s−1 channel, zoomed in on the central 2″ × 2″. The local void is clearly visible. The purple and white dashed circles have been added to guide the eye, centred on the continuum brightness peak location and the local void, respectively. Right panel: CO emission in the same channel. A lane of gas is seen bridging the gap between the AGB star and the position of the local void.
Current usage metrics show cumulative count of Article Views (full-text article views including HTML views, PDF and ePub downloads, according to the available data) and Abstracts Views on Vision4Press platform.
Data correspond to usage on the plateform after 2015. The current usage metrics is available 48-96 hours after online publication and is updated daily on week days.
Initial download of the metrics may take a while.