Fig. 10.
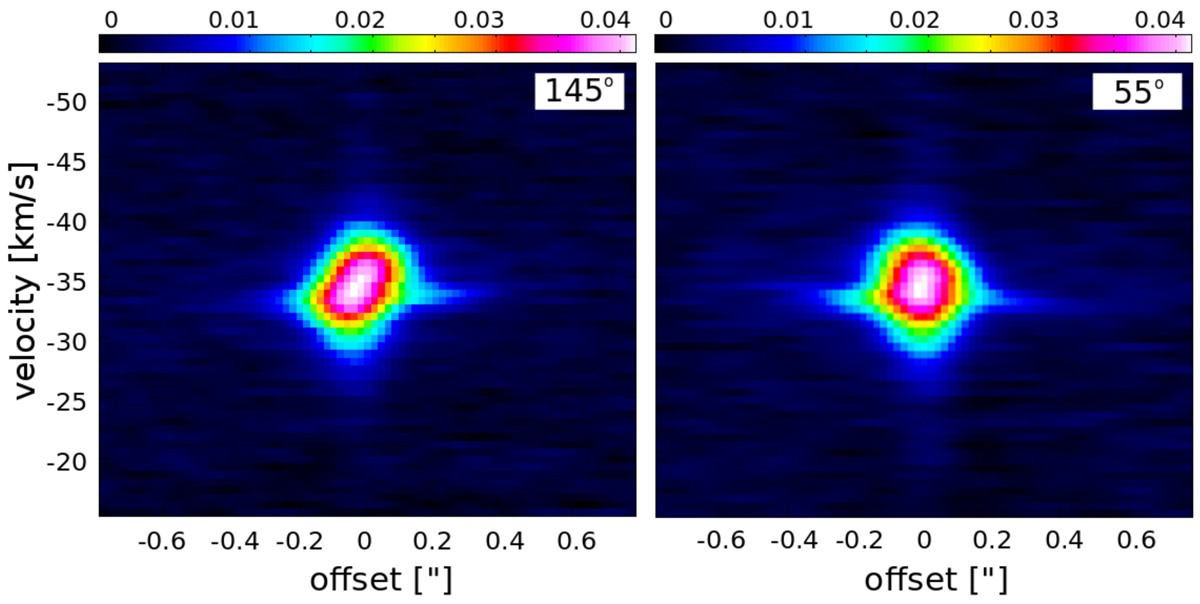
Orthogonal wide-slit PV diagrams of the SO2 emission. Flux density in Jy beam−1. The left panel shows the diagram generated by placing the slit at an angle of 145° (PV1), the right panel by placing the slit orthogonal to the first one (PV2). While PV2 shows a symmetrical emission distribution along both the central offset and velocity axes, the emission pattern in PV1 seems to be tilted clockwise. This is an indication of rotation around the 145° axis.
Current usage metrics show cumulative count of Article Views (full-text article views including HTML views, PDF and ePub downloads, according to the available data) and Abstracts Views on Vision4Press platform.
Data correspond to usage on the plateform after 2015. The current usage metrics is available 48-96 hours after online publication and is updated daily on week days.
Initial download of the metrics may take a while.