Fig. 1.
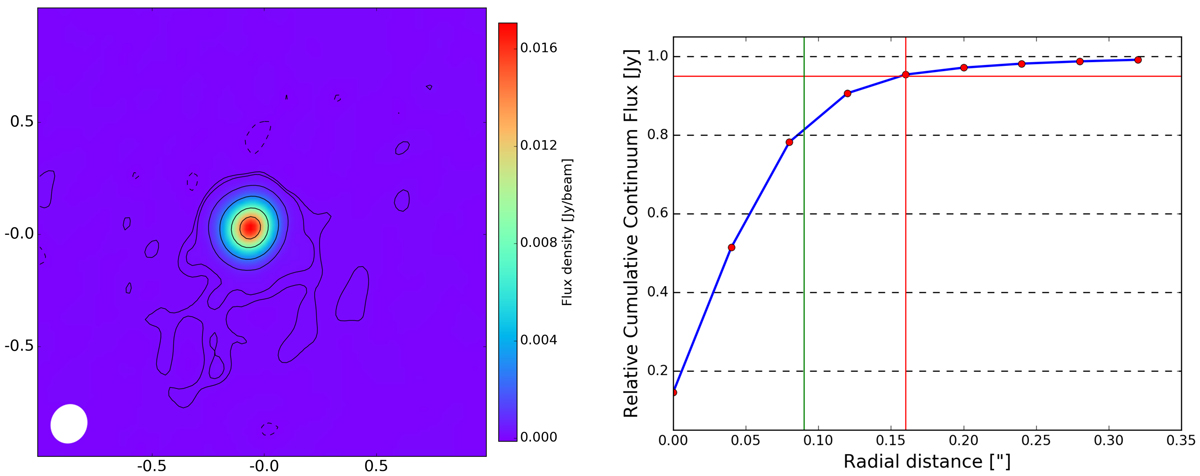
Left panel: continuum emission of the EP Aqr system. Contours are drawn at −3 (dashed), 3, 5, 25, 100, 300, and 500 times the continuum rms noise value (2.77 × 10⁻⁵ Jy beam−1). The ALMA beam size is shown in the bottom left corner. Right panel: azimuthally averaged normalised cumulative continuum flux distribution. The reference flux is the total continuum flux, amounting to 1.39 Jy. The red lines indicate the border of the region containing 95% of the total flux, at 0.16″. The green line indicates the radius of half the FWHM of the resolving beam.
Current usage metrics show cumulative count of Article Views (full-text article views including HTML views, PDF and ePub downloads, according to the available data) and Abstracts Views on Vision4Press platform.
Data correspond to usage on the plateform after 2015. The current usage metrics is available 48-96 hours after online publication and is updated daily on week days.
Initial download of the metrics may take a while.