Fig. 9.
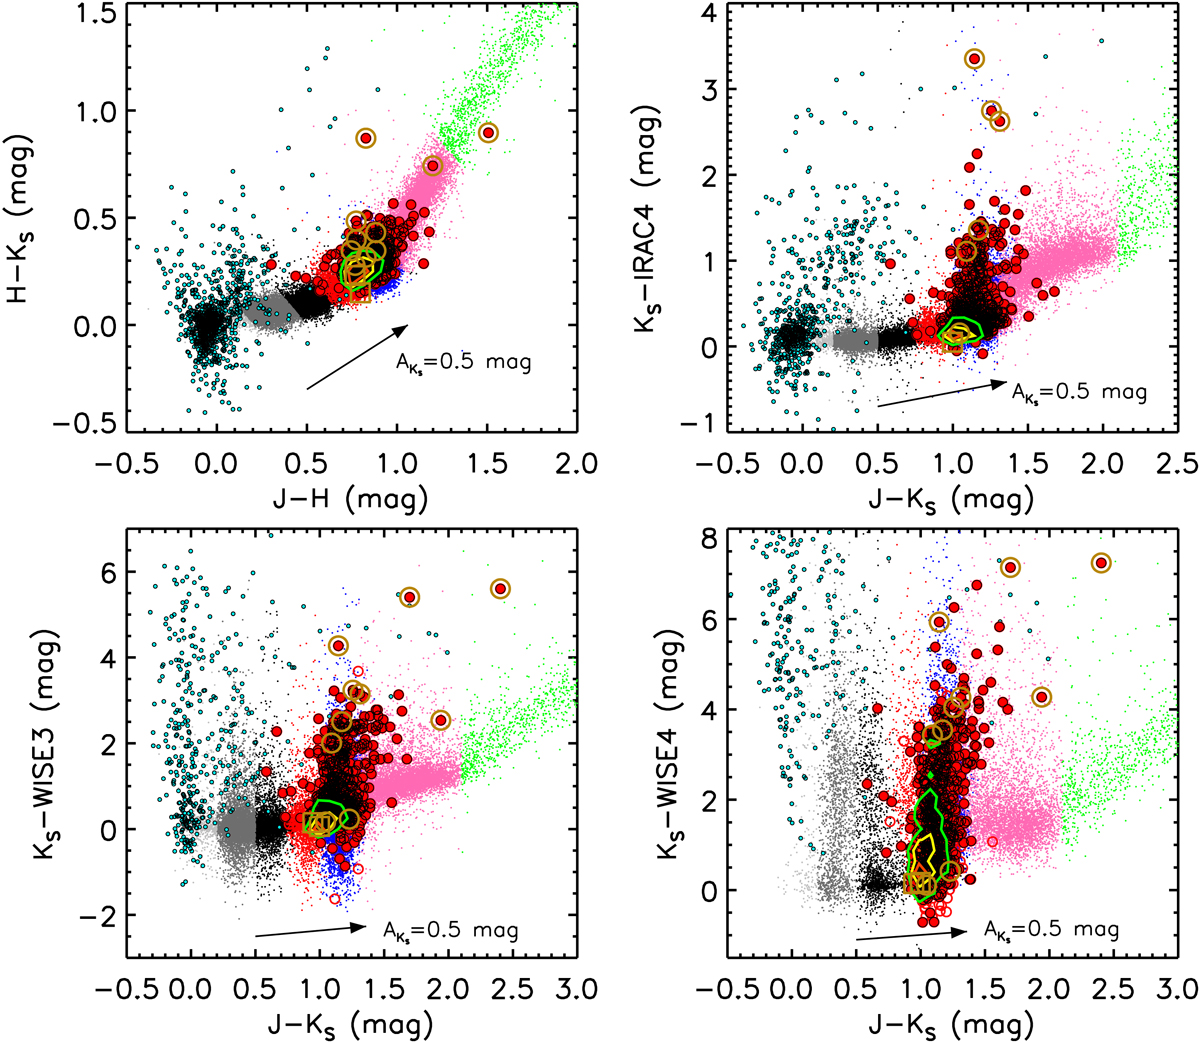
CCDs of J–H/H–KS, J–KS/KS– IRAC4, J–KS/KS–WISE3 and J–KS/ KS–WISE4 for the initial sample. An AKS ∼0.5 mag reddening vector is shown in the diagram for reference (same below). The two populations of RSGs (brighter and fainter) seen in previous CMDs also appearing in J–KS/ KS–IRAC4 and J–KS/KS–WISE3 diagrams due to the higher sensitivity in IRAC4/WISE3 compared to WISE4 band, with fainter population is clumped around the infrared excess turning point and the brighter population is extended toward the red end of KS–IRAC4/KS–WISE3 color.
Current usage metrics show cumulative count of Article Views (full-text article views including HTML views, PDF and ePub downloads, according to the available data) and Abstracts Views on Vision4Press platform.
Data correspond to usage on the plateform after 2015. The current usage metrics is available 48-96 hours after online publication and is updated daily on week days.
Initial download of the metrics may take a while.