Fig. 8.
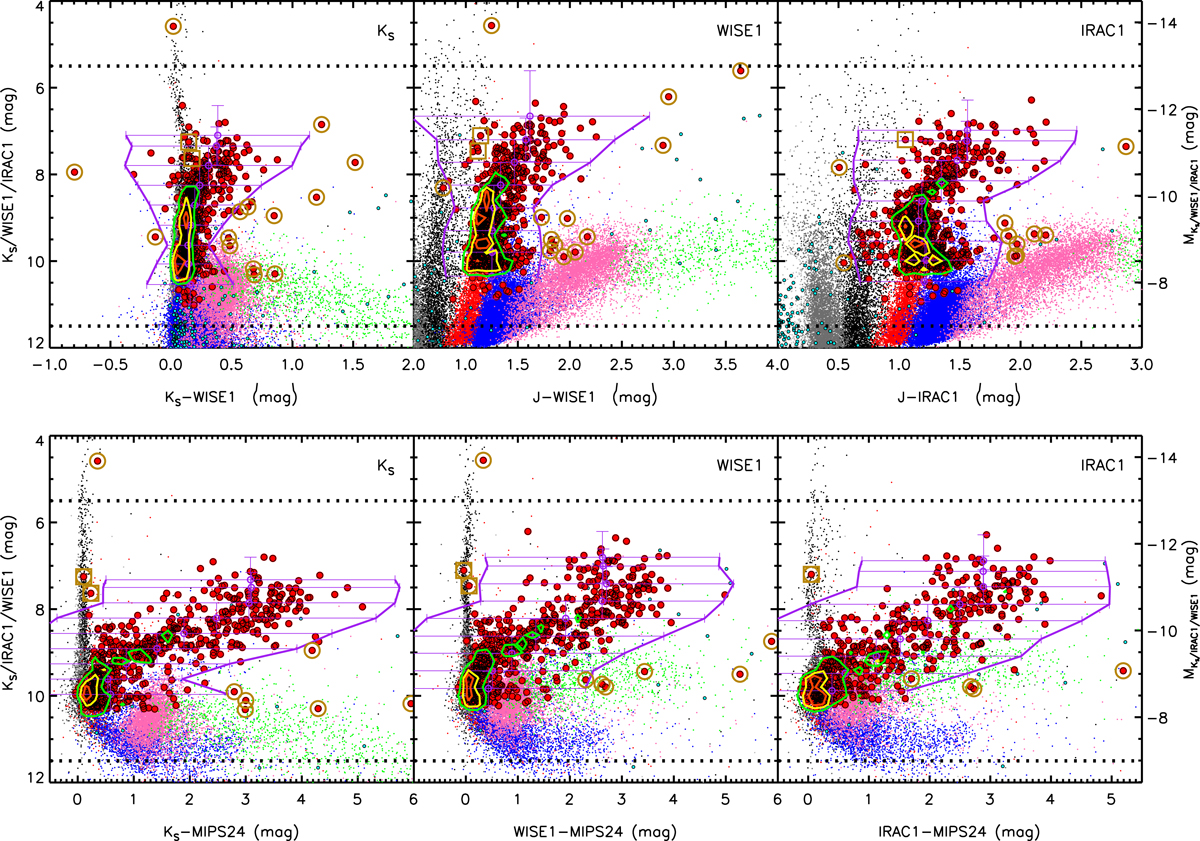
Same as Fig. 7 but for KS versus KS –WISE1 /KS –MIPS24, WISE1 versus J–WISE1/WISE1–MIPS24, IRAC1 versus J–IRAC1/IRAC1–MIPS24. The luminosity and color limits are shown as black dotted lines and purple solid lines in each diagram. Outliers (dark yellow open circles) are defined by absolute value of color indexes larger than Cmean + 3Cσ in two consecutive bins or too bright or too faint (see text for details). Targets with 95% confidence upper limit are shown as red open circles (same below).
Current usage metrics show cumulative count of Article Views (full-text article views including HTML views, PDF and ePub downloads, according to the available data) and Abstracts Views on Vision4Press platform.
Data correspond to usage on the plateform after 2015. The current usage metrics is available 48-96 hours after online publication and is updated daily on week days.
Initial download of the metrics may take a while.