Fig. 7.
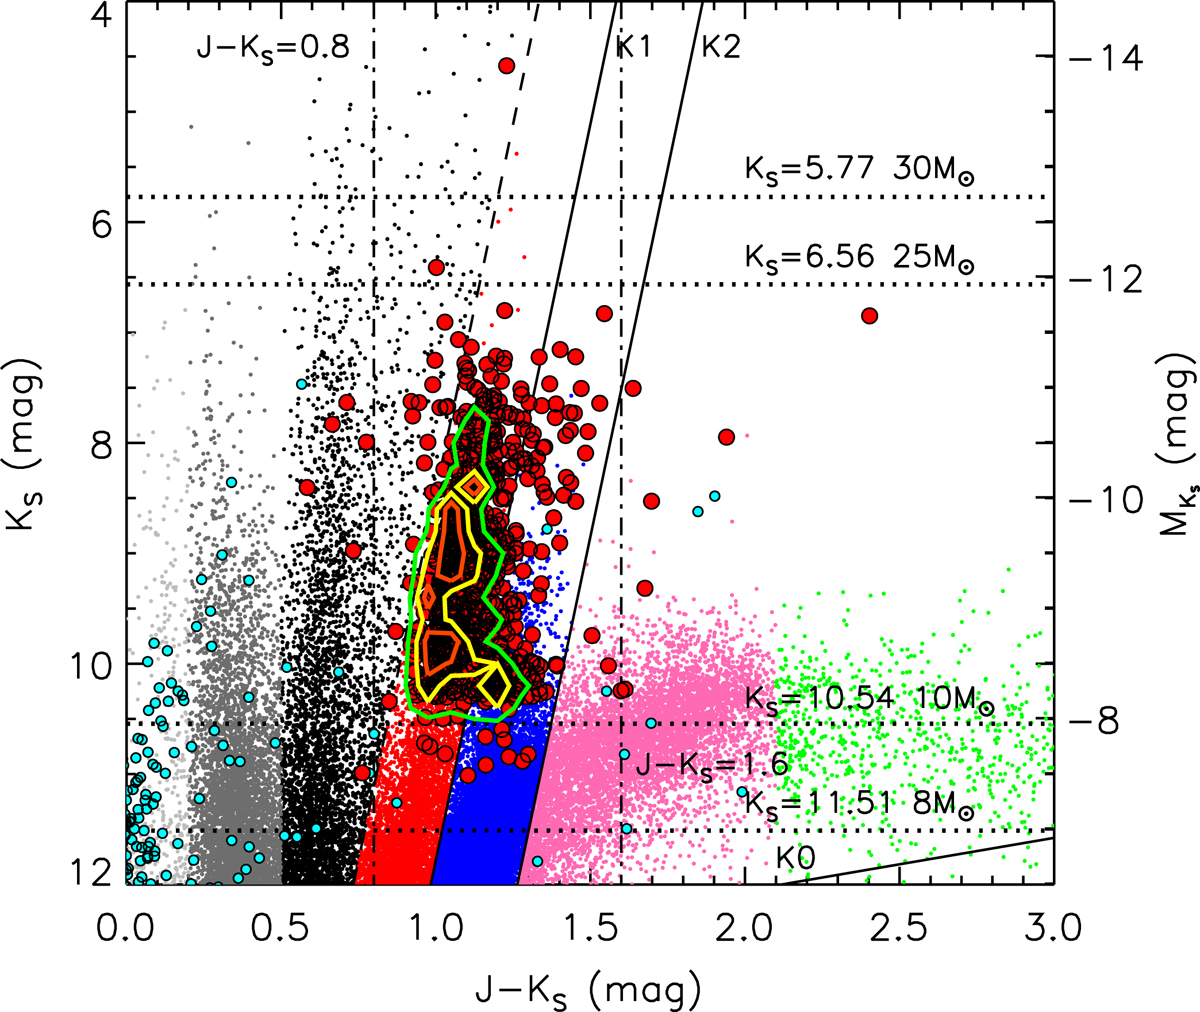
KS versus J–KS diagram for the initial sample. For comparison, the C-AGBs (blue), O-AGBs (pink), x-AGBs (green) and RSGs (red) regions defined by the theoretical J–KS color cuts (Cioni et al. 2006; Boyer et al. 2011), and 1268 massive stars (M≥ 8 M⊙) in the LMC from Bonanos et al. (2009) (cyan) are also shown in the diagram. Four horizontal dotted lines indicate the theoretical luminosity limits of 8, 10, 25 and 30 M⊙. The vertical dashed-dotted lines indicate the red boundary of carbon-rich stars as J–KS = 1.6 mag suggested by Hughes & Wood (1990) and a slightly strict blue boundary of J–KS = 0.8 mag. The 25%, 50% and 75% density contour levels are given by the orange, yellow and green lines, respectively (same below). From the diagram, it can be seen that our sample agrees well with the luminosity limits and most targets are located in a region of 6.5 < KS < 11.0 mag and 0.8 < J–KS < 1.6 mag, while about 71% of RSGs candidates are inside the defined RSGs region. See text for details.
Current usage metrics show cumulative count of Article Views (full-text article views including HTML views, PDF and ePub downloads, according to the available data) and Abstracts Views on Vision4Press platform.
Data correspond to usage on the plateform after 2015. The current usage metrics is available 48-96 hours after online publication and is updated daily on week days.
Initial download of the metrics may take a while.