Fig. 17.
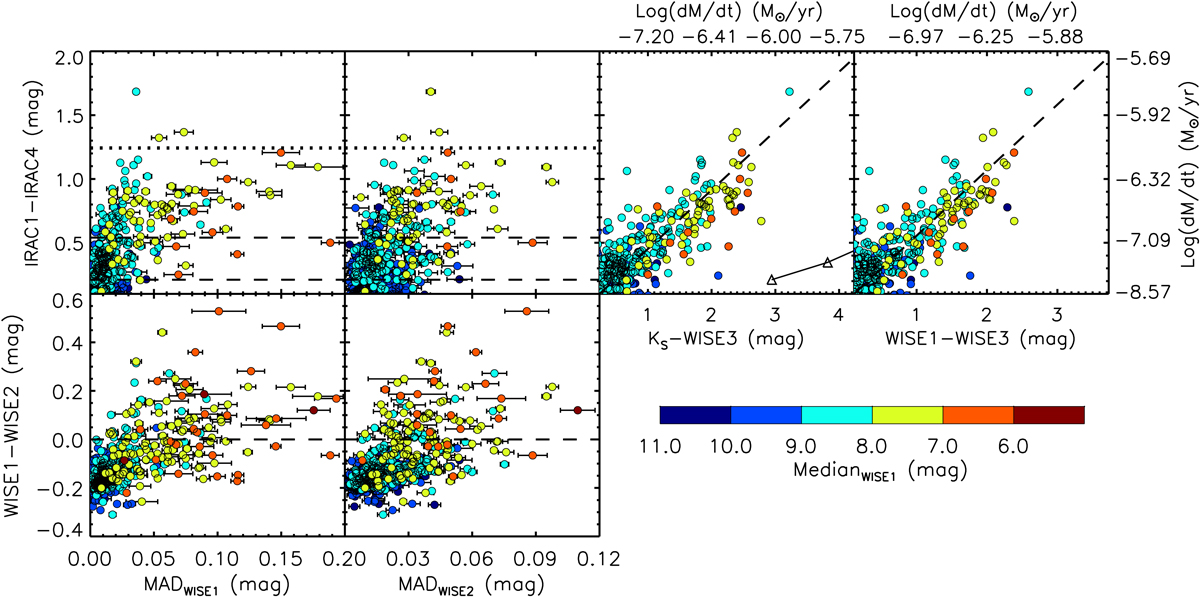
Variability versus infrared color diagrams. Upper left: MADWISE1/WISE2 versus IRAC1–IRAC4. The MLR is calculated by using the formula from Groenewegen & Sloan (2018), which is increasing along with the variability and probably approaching an upper limit of ∼-6:1 M⊙ yr-1 as shown by the dotted lines. The limits of MLR= -8.0M⊙ yr-1 and -7.0M⊙ yr-1 are also shown by the dashed lines. Upper right: a linear relation between IRAC1–IRAC4 andKS –WISE3/WISE1–WISE3 which can be used to derive MLR in KS –WISE3 and WISE1–WISE3 colors with slightly larger error. For comparison, the MLR calculated by using K–[12] color based on the MIR data from IRAS (Josselin et al. 2000) has been added in the KS –WISE3/IRAC1–IRAC4 diagram as shown by the open triangles (MLRK−[12] = − 8.0; −7.5M⊙ yr-1). It can be seen that the MLR calculated by using K–[12] is largely underestimated compared with the one calculated by using IRAC1–IRAC4. Bottom: Previous known “blue” RSGs(WISE1–WISE2/IRAC1–IRAC2 < 0) in WISE1–WISE2/IRAC1–IRAC2 are turning redder (WISE1–WISE2/IRAC1–IRAC2 > 0) along with the increasing of variability.
Current usage metrics show cumulative count of Article Views (full-text article views including HTML views, PDF and ePub downloads, according to the available data) and Abstracts Views on Vision4Press platform.
Data correspond to usage on the plateform after 2015. The current usage metrics is available 48-96 hours after online publication and is updated daily on week days.
Initial download of the metrics may take a while.