Fig. 15.
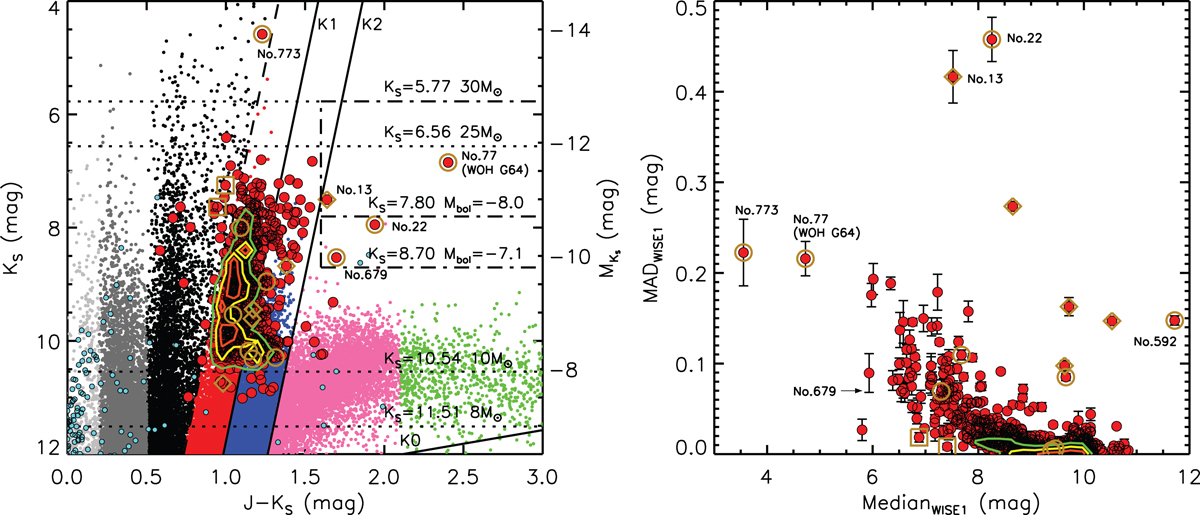
Left: same as Fig. 7 with peculiar outliers indicated on the diagram. Additional constrains of J–KS > 1.6 mag, KS < 7.80 mag (Mbol <−8.0 mag), KS < 8.70 mag (Mbol < −7.1 mag) and KS > 5.77 mag(<30M⊙) are shown by the dashed-dotted lines. Targets inside this region are likely to be either super-AGBs or RSGs. Right: same as Fig. 13 with peculiar outliers indicated. Considering luminosity, color and MIR variaility from both panels, it appears that the No. 13 and 22 might be super-AGBs while No. 679 might be a dust-obscured RSG.
Current usage metrics show cumulative count of Article Views (full-text article views including HTML views, PDF and ePub downloads, according to the available data) and Abstracts Views on Vision4Press platform.
Data correspond to usage on the plateform after 2015. The current usage metrics is available 48-96 hours after online publication and is updated daily on week days.
Initial download of the metrics may take a while.