Fig. 13.
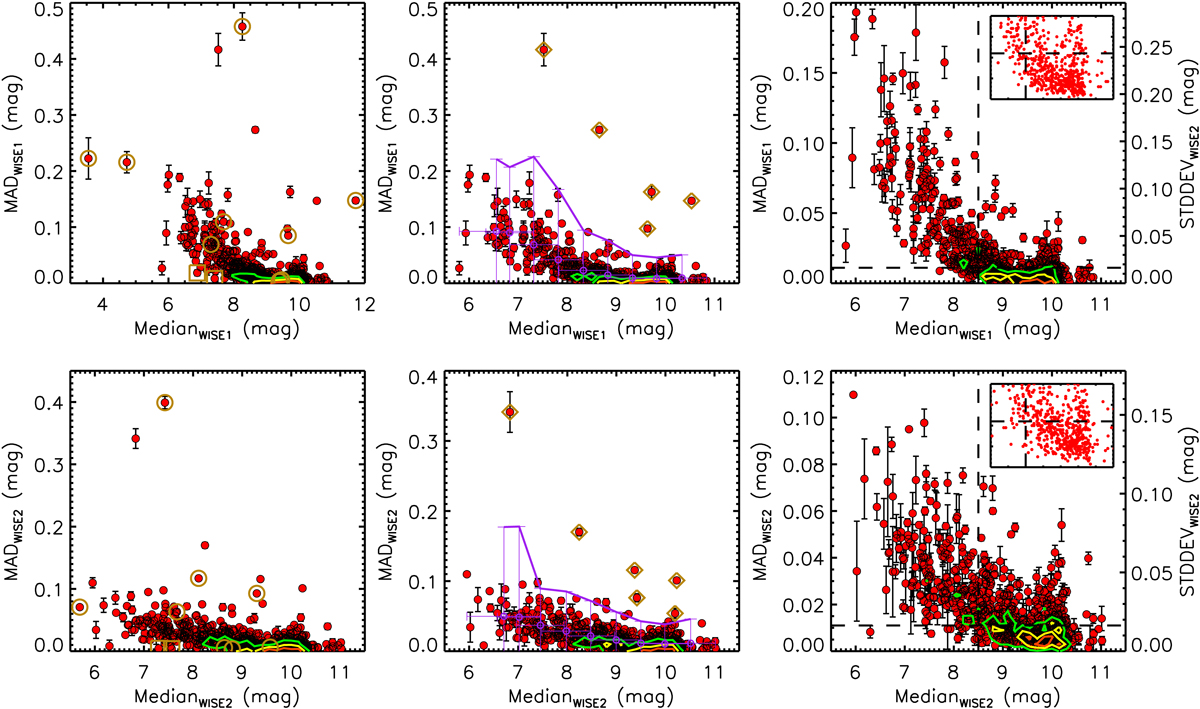
WISE1/WISE2 median magnitude versus MAD diagrams. From left to right: initial sample with previous identified outliers; the same diagram with previous outliers removed and new outliers based on variability identified with dark yellow open diamonds; the final cleaned dataset with all outliers removed, where the insert panels show the range of 7.5 < medianWISE1/WISE2< 11.0 mag and MADWISE1/WISE2<0.02 mag. Error bars show the short-term (approximately five to ten days) variability within each epoch calculated by MAD (same below). See text for details.
Current usage metrics show cumulative count of Article Views (full-text article views including HTML views, PDF and ePub downloads, according to the available data) and Abstracts Views on Vision4Press platform.
Data correspond to usage on the plateform after 2015. The current usage metrics is available 48-96 hours after online publication and is updated daily on week days.
Initial download of the metrics may take a while.