Fig. 10.
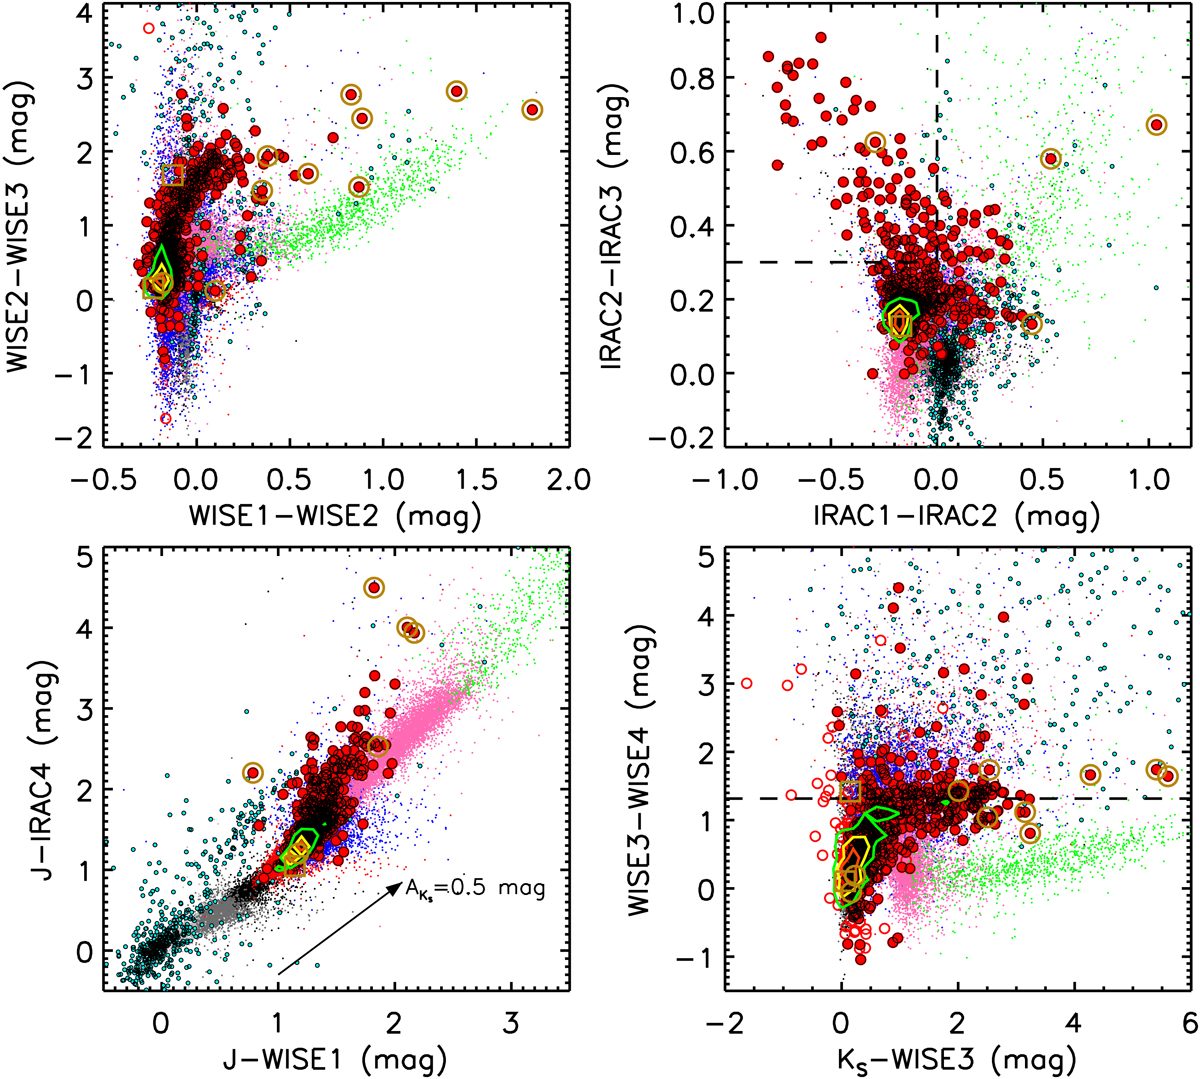
Same as Fig. 9 but for WISE1–WISE2/WISE2–WISE3, IRAC1–IRAC2/IRAC2–IRAC3, J–WISE1/J–IRAC4 and KS –WISE3/WISE3–WISE4. A group of targets (∼15%, upper leftregion covered by the dashed lines) with probable PAH feature show redder color in IRAC2–IRAC3 and even bluer color in IRAC1–IRAC2 than the others in the IRAC1–IRAC2/IRAC2–IRAC3 diagram. The dashed line (WISE3–WISE4 ≈ 1:3 mag) in the KS –WISE3/WISE3–WISE4 diagram indicates the color where Fμ(WISE4) = Fμ = (WISE3).
Current usage metrics show cumulative count of Article Views (full-text article views including HTML views, PDF and ePub downloads, according to the available data) and Abstracts Views on Vision4Press platform.
Data correspond to usage on the plateform after 2015. The current usage metrics is available 48-96 hours after online publication and is updated daily on week days.
Initial download of the metrics may take a while.