Fig. 7.
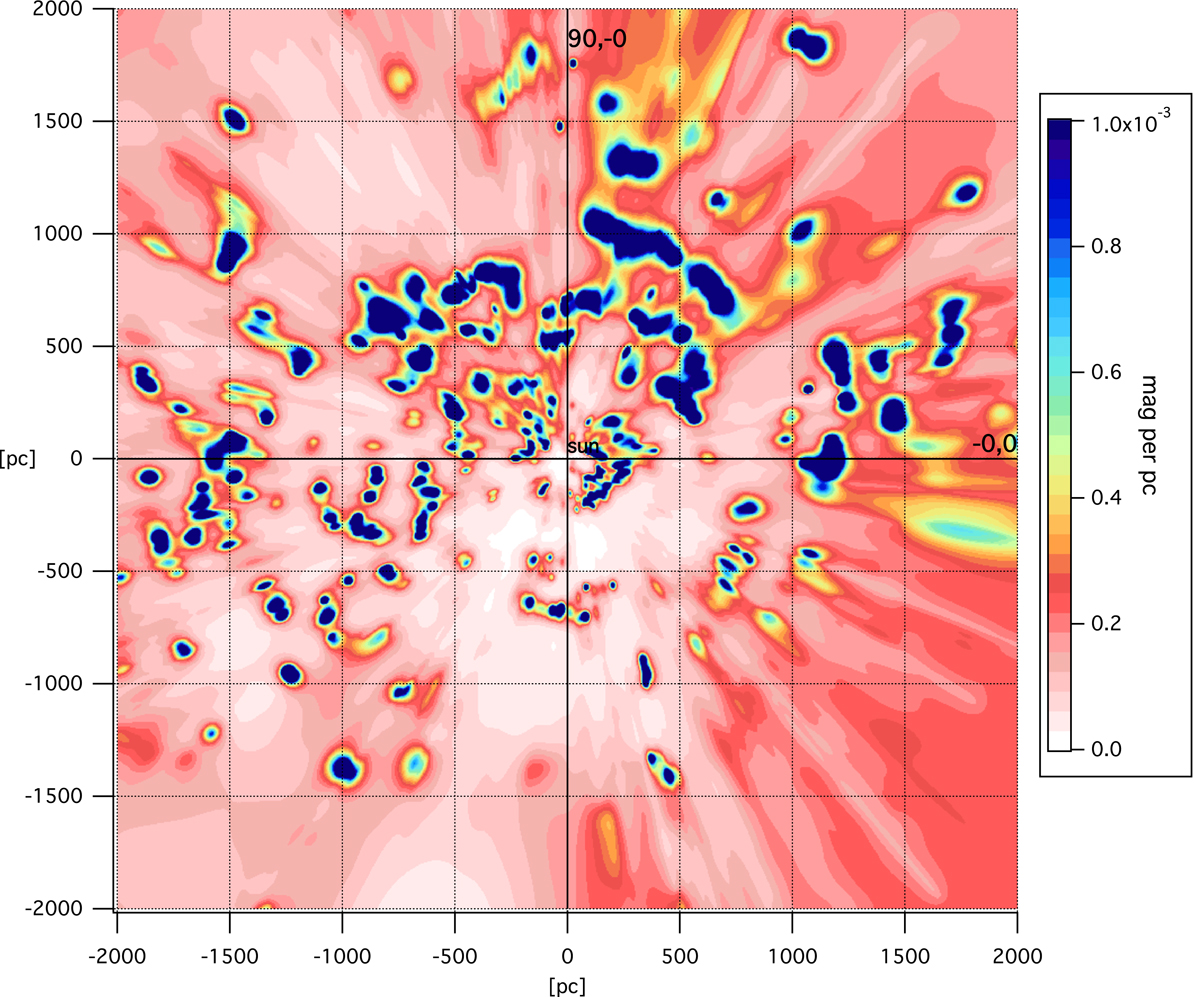
Differential color excess in the Galactic plane computed as a planar cut along the Galactic equator through the 3D distribution. The Sun is at the center of the image (coordinates 0, 0). The Galactic center direction is to the right. The units are mag pc−1. The map can be directly compared with the previous similar map from Capitanio et al. (2017).
Current usage metrics show cumulative count of Article Views (full-text article views including HTML views, PDF and ePub downloads, according to the available data) and Abstracts Views on Vision4Press platform.
Data correspond to usage on the plateform after 2015. The current usage metrics is available 48-96 hours after online publication and is updated daily on week days.
Initial download of the metrics may take a while.