Fig. 4.
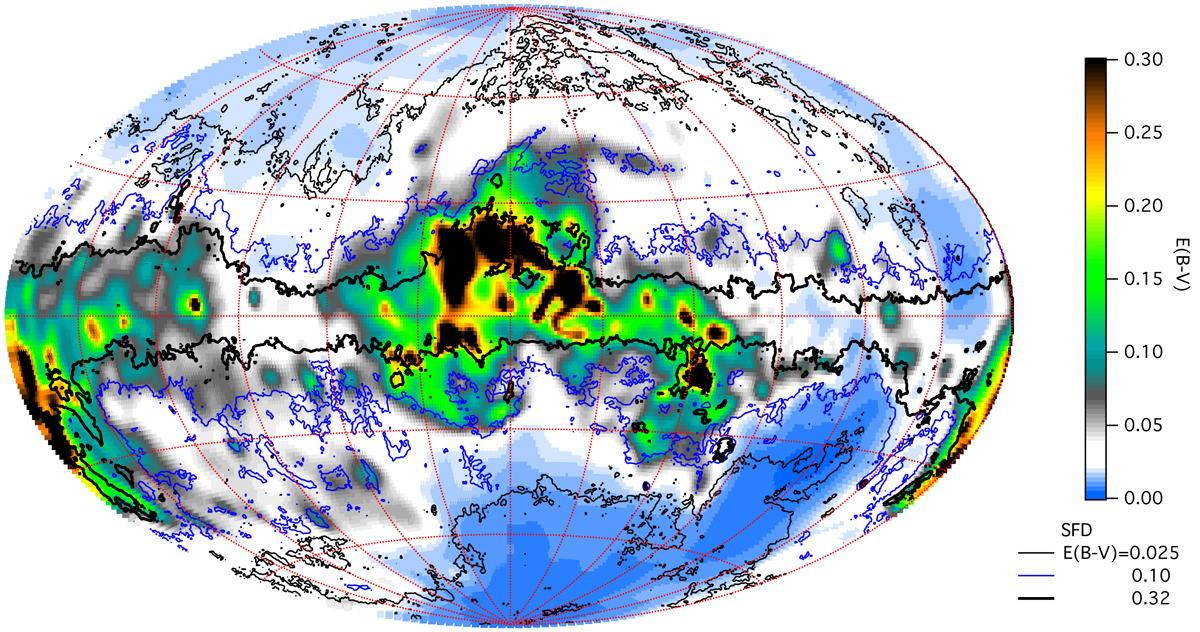
Cumulative color excess E(B–V) computed by integration of the differential color excess along radial directions, from the Sun up to a distance of 300 pc. Isocontours derived from the SFD98 reddening map are superimposed. The comparison shows that all northern high-latitude arches seen at longitudes −150 ≤ 1 ≤ +40° and with E(B–V) ≥ 0.025 mag are closer than 300 pc (see text).
Current usage metrics show cumulative count of Article Views (full-text article views including HTML views, PDF and ePub downloads, according to the available data) and Abstracts Views on Vision4Press platform.
Data correspond to usage on the plateform after 2015. The current usage metrics is available 48-96 hours after online publication and is updated daily on week days.
Initial download of the metrics may take a while.