Fig. 10.
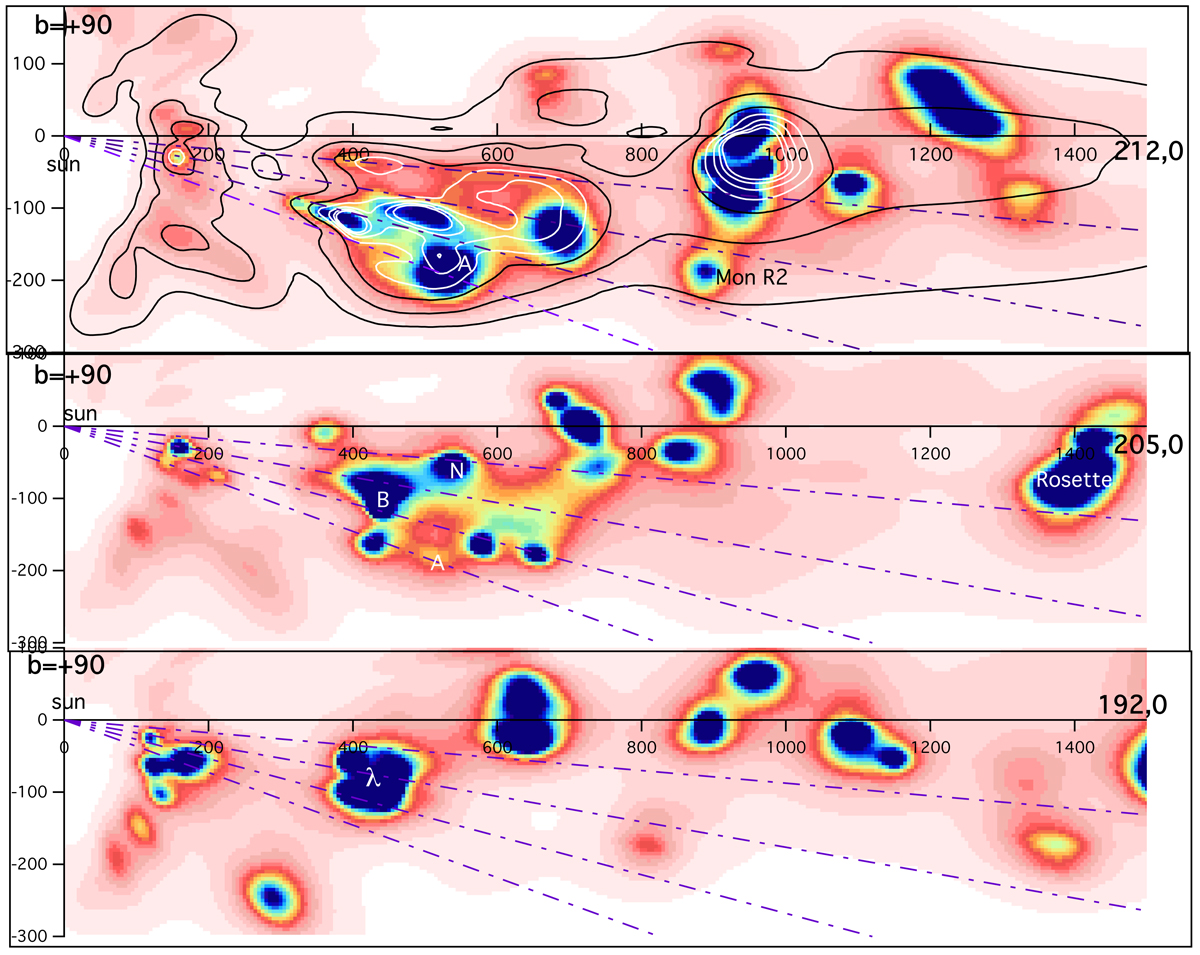
Differential color excess in a vertical plane containing the Sun and along the Galactic longitudes l = 212, 205, and 192° from top to bottom. The maps show the distribution of the main Orion clouds. Superimposed as black or white lines on the top graph are isocontours of the differential color excess from the previous inversion of Capitanio et al. (2017). The new 3D distribution reveals more clouds at large distance (e.g., the clouds beyond 800 pc) and resolves more structures in the main Orion region between 400 and 700 pc. We indicate the structures A, B, N as well as λ Ori, Mon R2, and Rosette at the locations predicted by Lombardi et al. (2011) and Schlafly et al. (2015).
Current usage metrics show cumulative count of Article Views (full-text article views including HTML views, PDF and ePub downloads, according to the available data) and Abstracts Views on Vision4Press platform.
Data correspond to usage on the plateform after 2015. The current usage metrics is available 48-96 hours after online publication and is updated daily on week days.
Initial download of the metrics may take a while.